End-to-end process · Touchless order processing

Order-to-Cash

How causal process mining shows which customer orders can run touchless – and where a targeted review protects quality.

Touchless, but not at any price

Many order-to-cash initiatives pursue the same goals: more automation, reliable deliveries and fewer complaints. A high touchless rate initially looks like the logical target.

But not every manual step is waste. Some reviews prevent errors, others really only cost time.

Touchless is not a goal in itself. What matters is which orders need a human – and which do not.

What is Order-to-Cash?

Order-to-cash (O2C) is the end-to-end process from order entry to payment clearing. It covers order capture and release, delivery and invoicing, payment and dunning, and complaints and rework. On a process slide O2C often looks linear – in the operational data, however, it is a network of business objects and dependencies: customer order, item, configuration, change, review, delivery, invoice, payment and complaint are all connected. Causal process mining keeps this granularity and builds the fitting causal perspective only for the concrete business question.

Note: the figures on this page come from a synthetic order-to-cash dataset. They illustrate the analysis method and are not production figures of any customer.

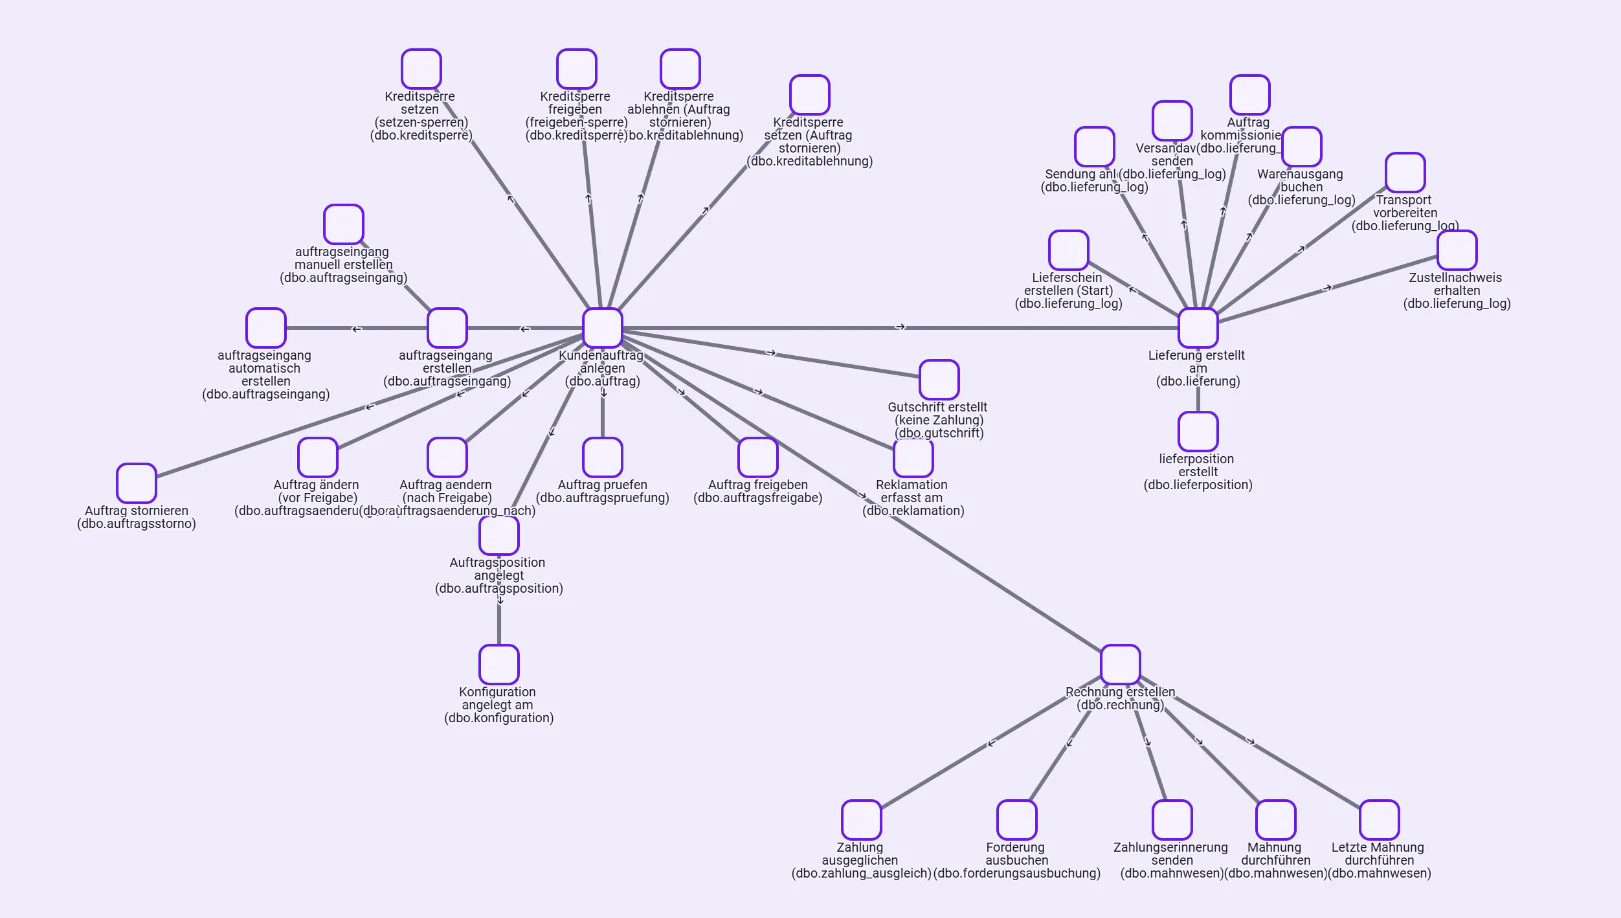
Event knowledge graph of the order-to-cash process: the customer order at the centre, connected to order entry, credit block, order change, order review, release, order item and configuration, complaint and credit note, delivery with delivery note, picking, goods issue, shipping, transport and proof of delivery, and invoice with payment, dunning and write-off
Event knowledge graph of the O2C process: business objects and their relationships are preserved – complexity is reduced during analysis, not already at data import.

At a glance

4,500

Customer orders

entire synthetic O2C dataset

46.37%

Touchless rate

1,978 of 4,266 consistently assessable orders

86.92%

OTIF rate

3,708 of 4,266 consistently assessable orders

207

Orders with complaints

4.60% of all 4,500 orders

76.33%

Complaints from configurations

technical and service configurations – at only 35.42% of the order volume

197 / 340

Changes without review

orders changed before release go straight to release (about 58%)

The process in three phases

The end-to-end causal perspective brings order entry, delivery, invoice, payment and complaint together in one business view. Complexity is reduced during analysis – not already at data import.

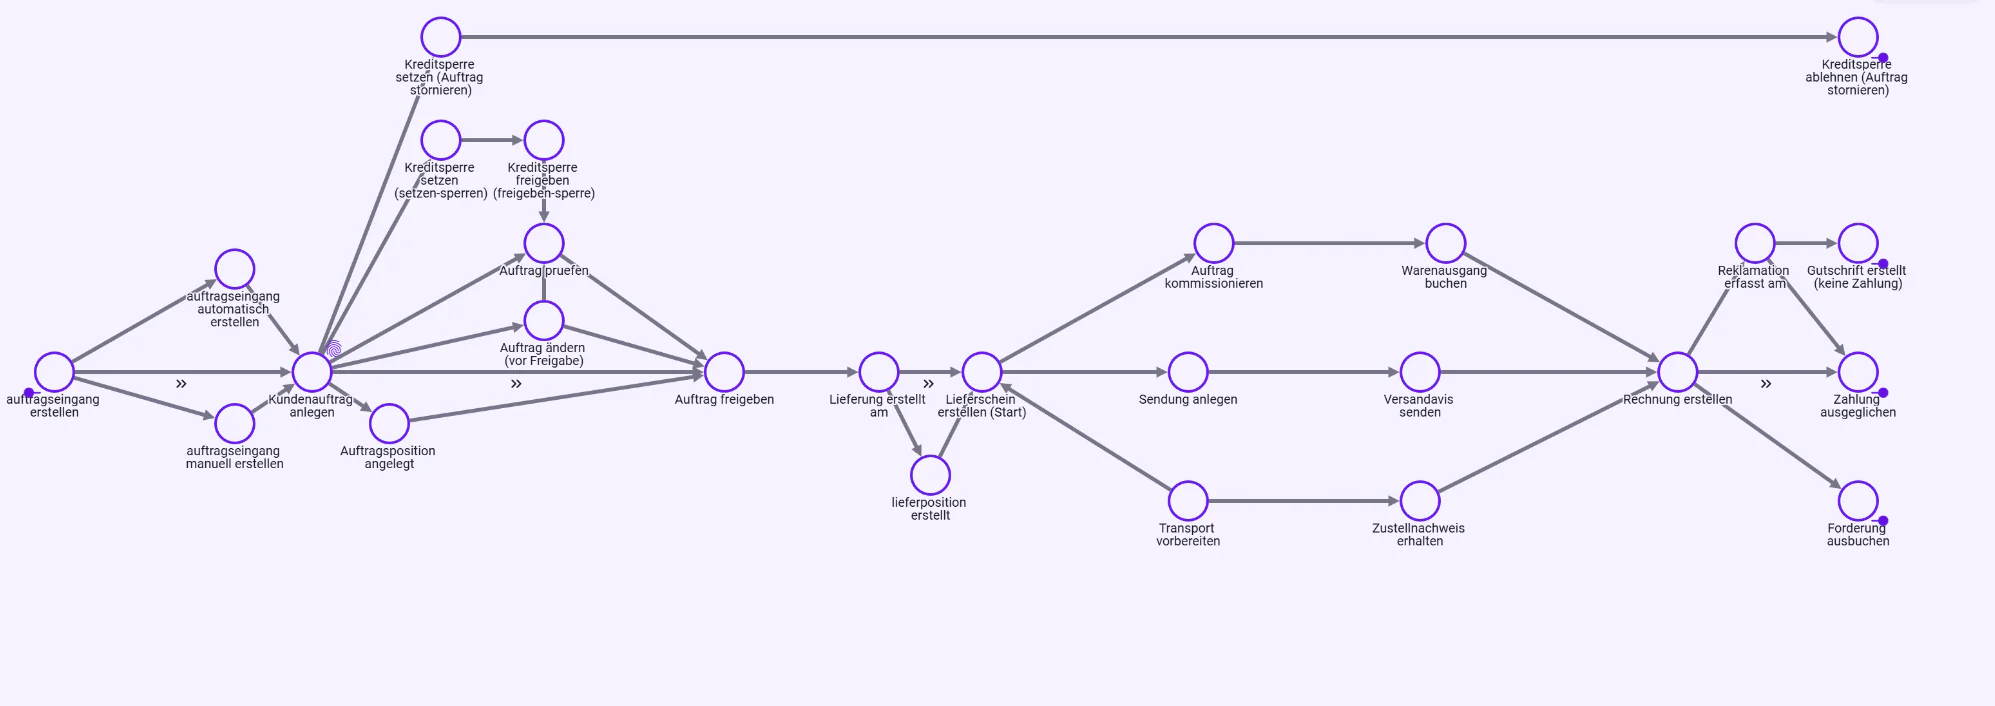
End-to-end causal perspective of the order-to-cash process from order entry through customer order, credit block, order change, order review and release, delivery with picking, shipping and transport, to invoice, payment clearing, complaint, credit note and write-off
End-to-end causal perspective of the O2C process from order entry to payment and complaint.

Phase 1

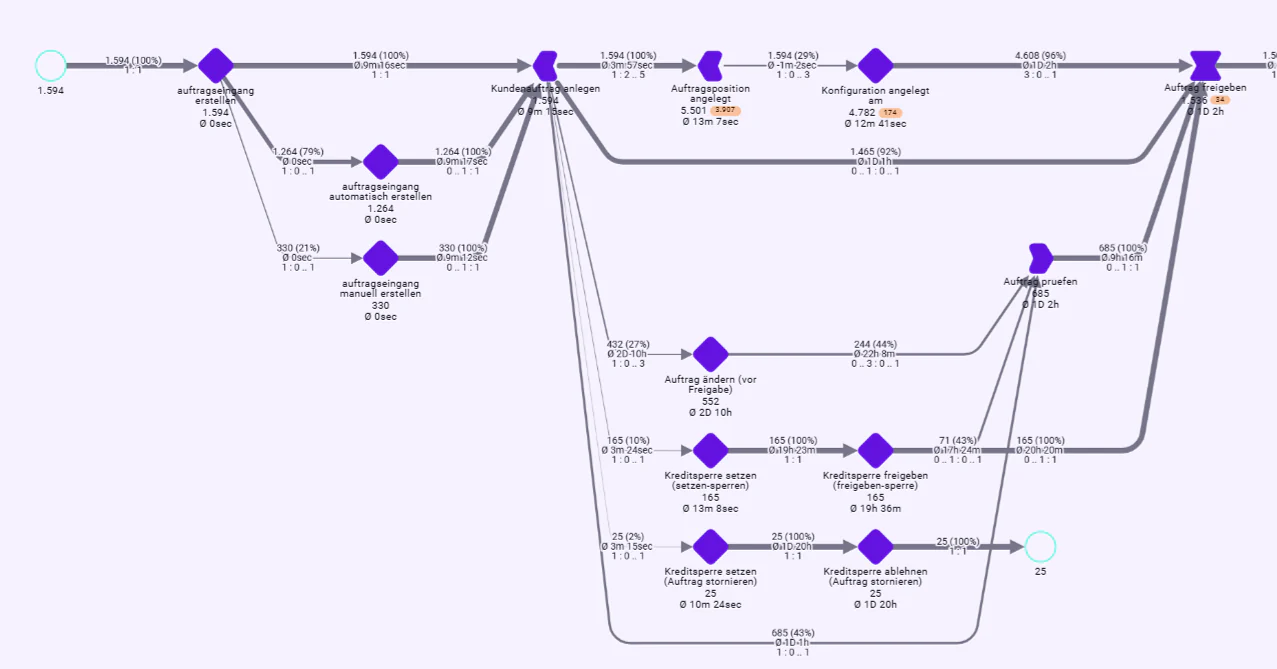
Order entry, configuration & release

Orders are captured automatically or manually and created as a customer order with items and configuration. Depending on the order, a credit check, changes before release and an order review follow before the order is released.

Business objects

  • Customer order
  • Order item
  • Configuration
  • Order change
  • Order review
  • Credit check
  1. Create order entry
  2. Create customer order
  3. Order item created
  4. Configuration created
  5. Change order (before release)
  6. Review order
  7. Release order

Guiding question

Which orders can be released automatically – and which need a review because of their risk?

Order entry process graph: automatic and manual order capture, create customer order, order item and configuration, credit blocks, change order (before release), review order and release order
Order entry, configuration, change, review and release.

Phase 2

Delivery & invoicing

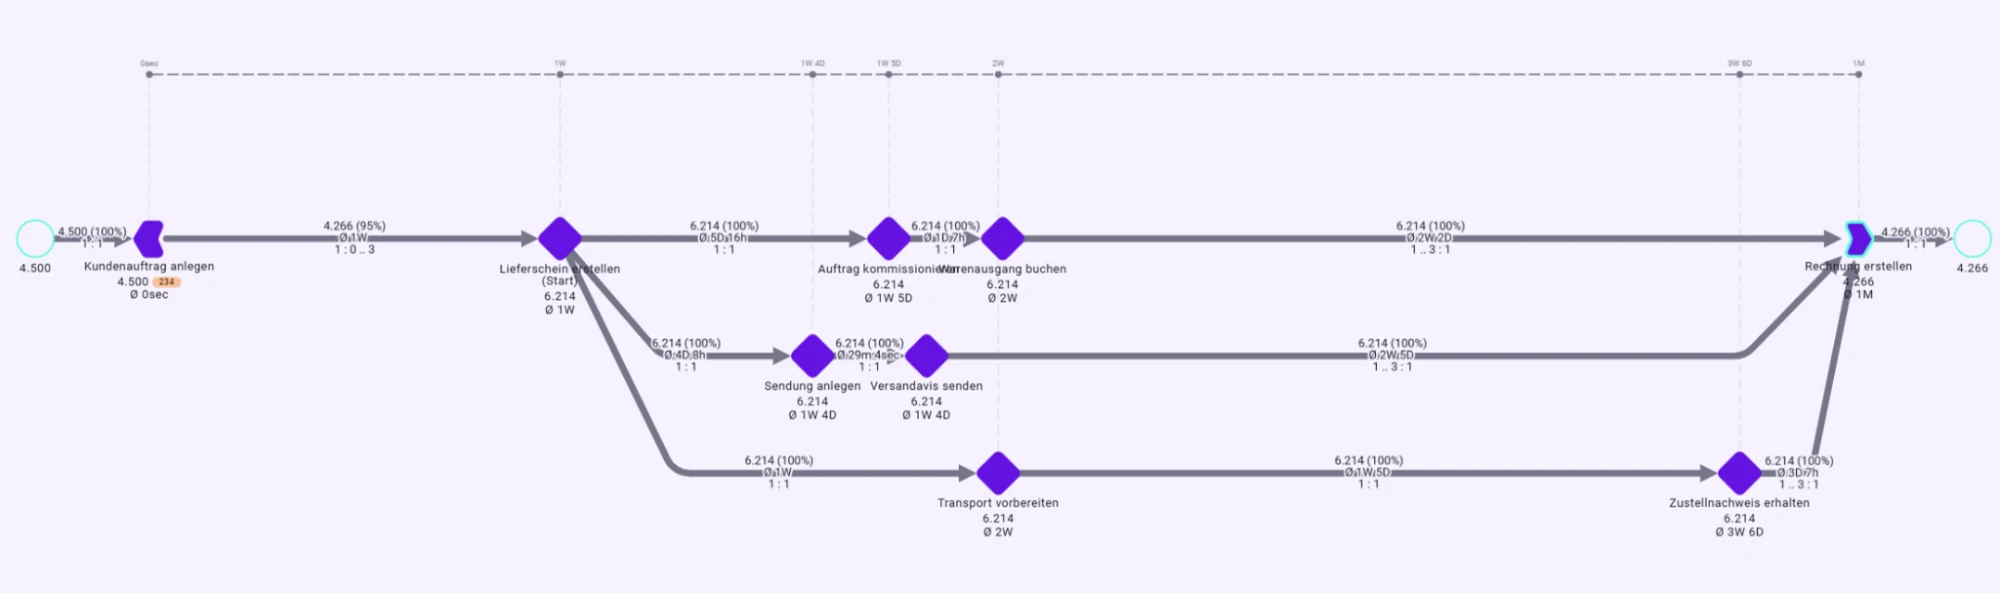
After release, delivery starts with the delivery note. Picking and goods issue, shipping, and transport and delivery run as separate strands with their own objects and join again in the invoice.

Business objects

  • Customer order
  • Delivery
  • Shipment
  • Transport
  • Proof of delivery
  • Invoice

Picking

  1. 1Create delivery note
  2. 2Pick order
  3. 3Post goods issue

Shipping

  1. 1Create shipment
  2. 2Send shipping notification

Transport & delivery

  1. 1Prepare transport
  2. 2Receive proof of delivery

Guiding question

Where do deviations in delivery reliability and lead time arise – in your own flow or in connected delivery and transport objects?

Delivery process graph with a time axis: from the customer order via delivery note, picking and goods issue, shipment and shipping notification, and transport and proof of delivery to the invoice
Delivery from the delivery note through picking and transport to the invoice.

Phase 3

Payment, dunning & complaint

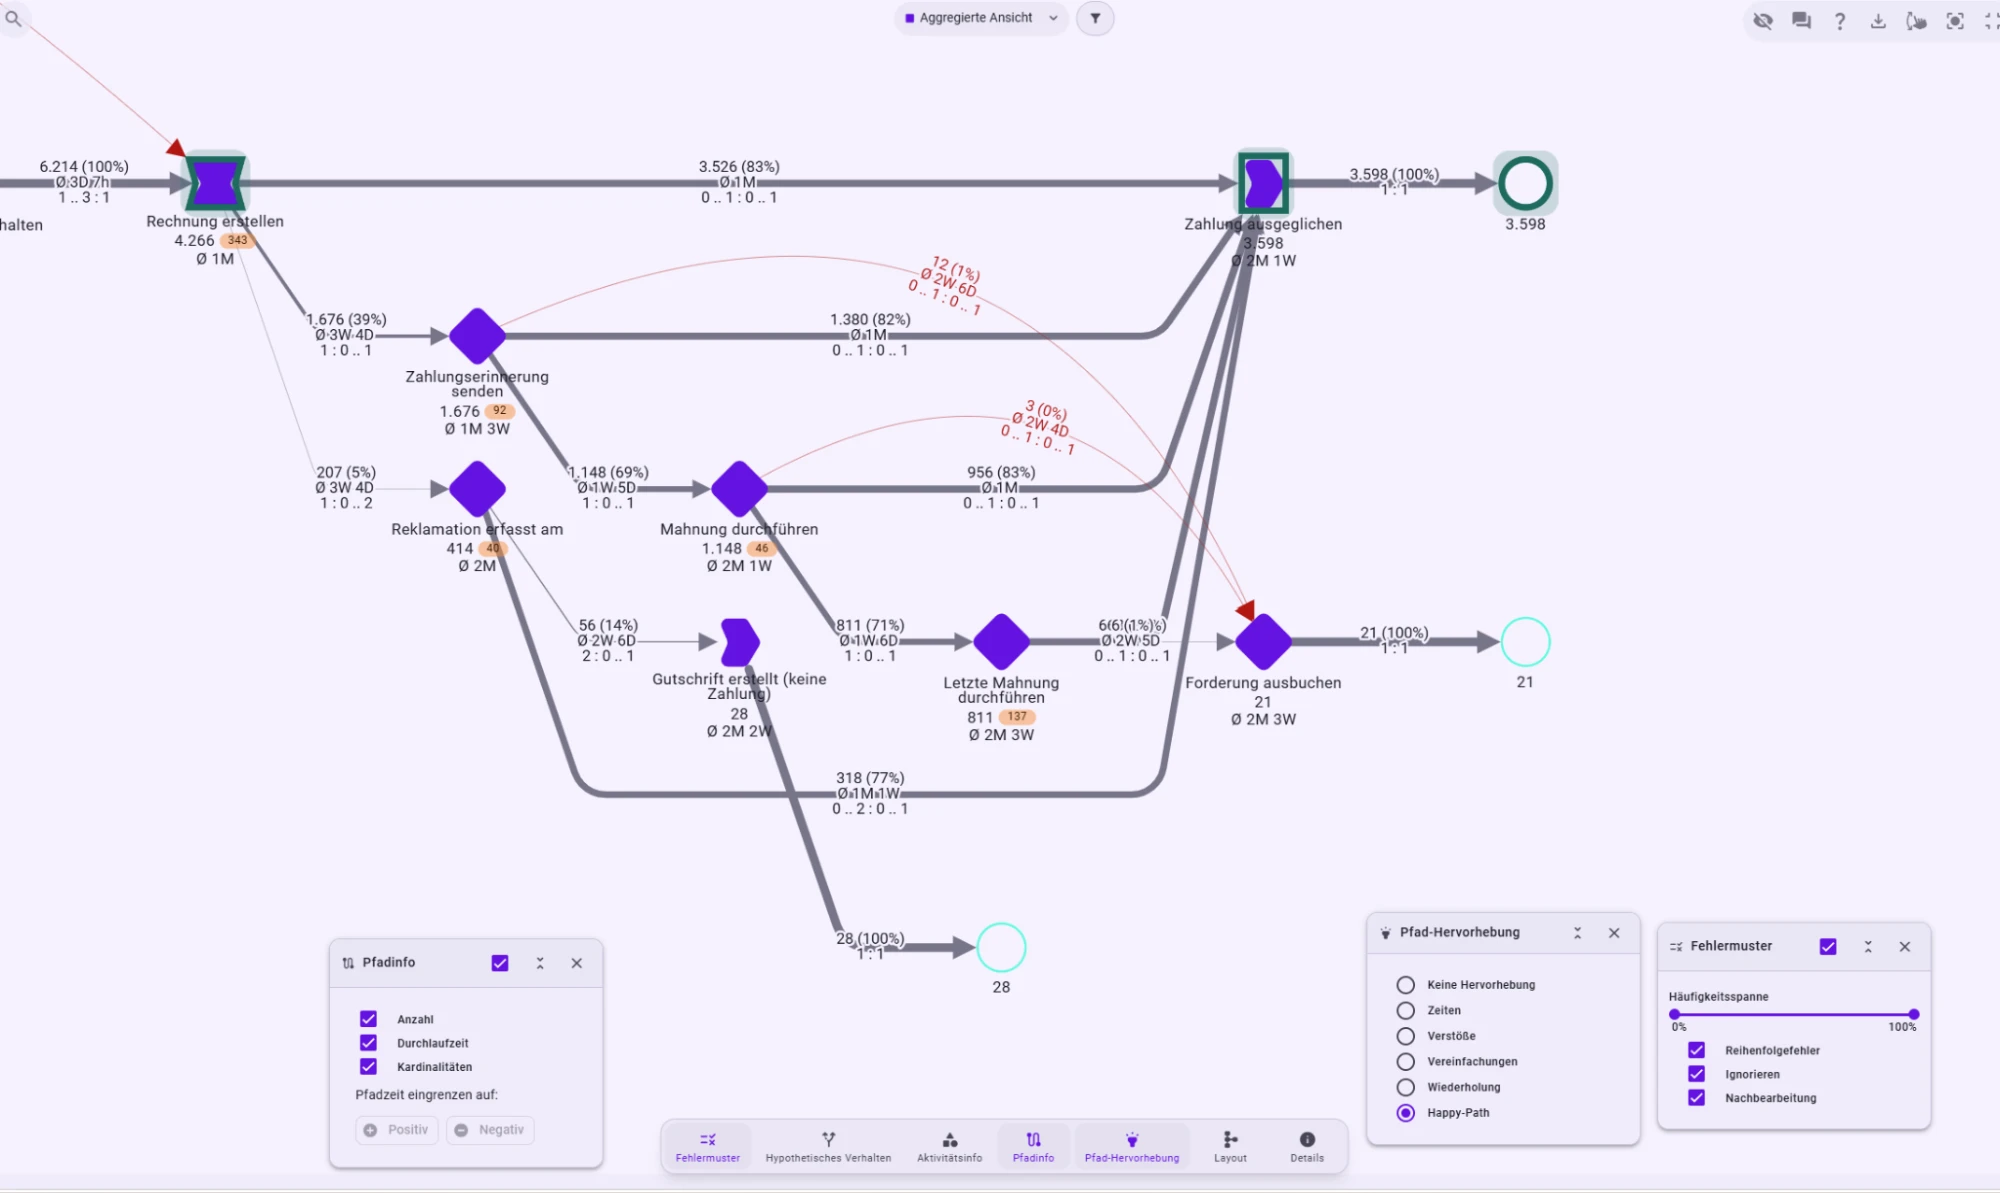
After invoicing, the process leads straight to payment clearing or runs through payment reminder, dunning, credit note or write-off. Complaints form an additional business path.

Business objects

  • Invoice
  • Payment
  • Receivable
  • Credit note
  • Complaint

Payment

  1. 1Create invoice
  2. 2Payment cleared

Dunning

  1. 1Send payment reminder
  2. 2Dunning notice
  3. 3Final dunning notice
  4. 4Write off receivable

Complaint

  1. 1Complaint recorded
  2. 2Credit note issued (no payment)

Guiding question

Which upstream process conditions explain complaints and other downstream effects?

Process graph after the invoice: direct payment clearing (83%), payment reminder, dunning and final dunning up to the write-off, and complaint with credit note; path info, happy-path highlighting and error patterns are shown
Payment, dunning and complaint paths after invoicing.

A customer order can have several items and configurations, trigger several deliveries and be closed through invoice, payment, dunning or complaint. The figures on this page are therefore measured at customer-order level – without multiple weighting through items or partial deliveries.

Five findings along the order-to-cash process

The findings lead from the management KPI to a testable review rule. Each one shifts the question from “What happened?” to “Why did it happen – and what follows from it?”.

Finding 1 · Touchless

Touchless shows the what – but not yet the why

At 46.37%, not even every second assessed order runs fully touchless. The obvious reaction would be to remove as many manual steps as possible.

But the KPI does not say which intervention is superfluous and which protects quality. The same is true of the other management KPIs at order level: the OTIF rate is 86.92% and 207 orders received complaints – the result is visible, its cause is not.

46.37%

touchless rate: 1,978 of 4,266 consistently assessable orders run without manual intervention

Instead of “How do we remove more manual steps?”

the analysis asks: “Which manual steps add no value – and which protect a risky order from a costly error?”

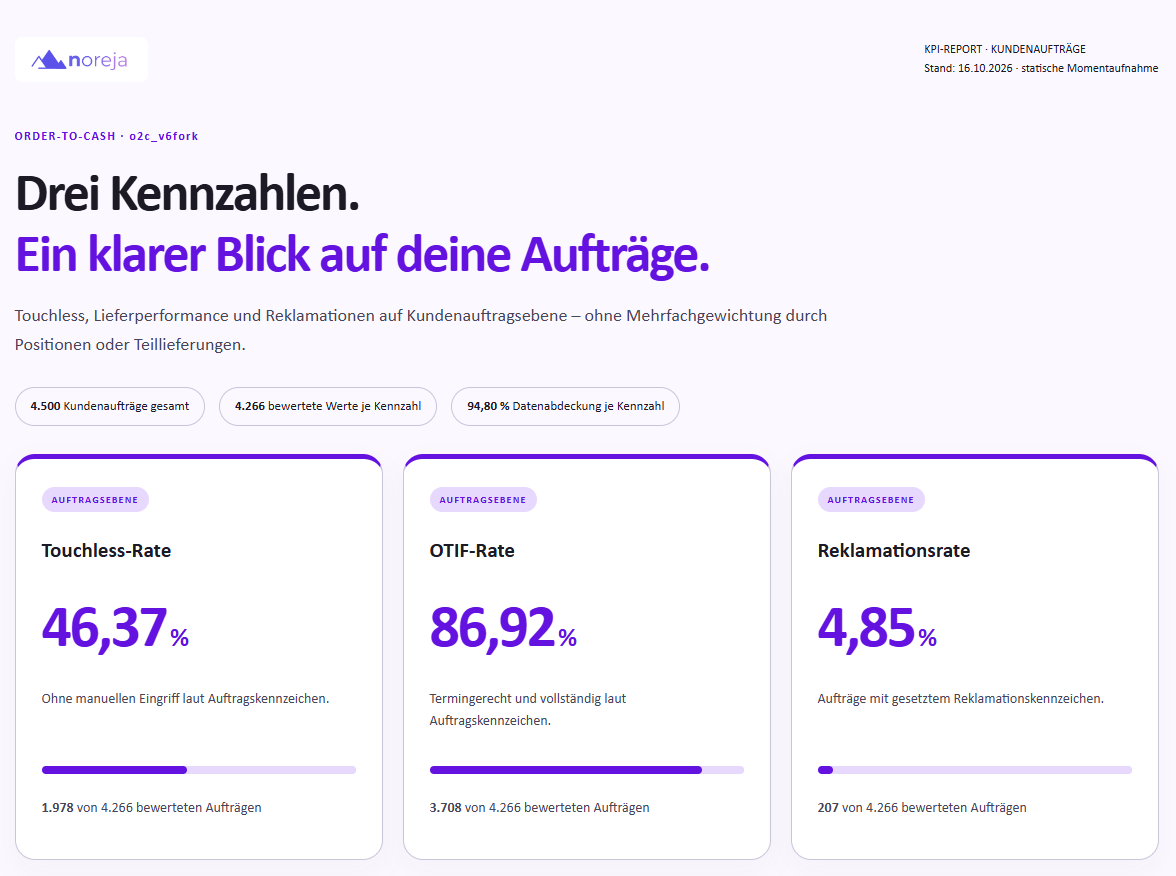
Order-to-cash KPI report on customer orders: touchless rate 46.37% (1,978 of 4,266 assessed orders), OTIF rate 86.92% (3,708 of 4,266) and complaint rate 4.85% (207 of 4,266)
Management KPIs at order level. The complaint rate here refers to 4,266 assessed orders (4.85%); relative to all 4,500 orders it is 4.60%.

Finding 2 · Complaints

Complaints concentrate on configured orders

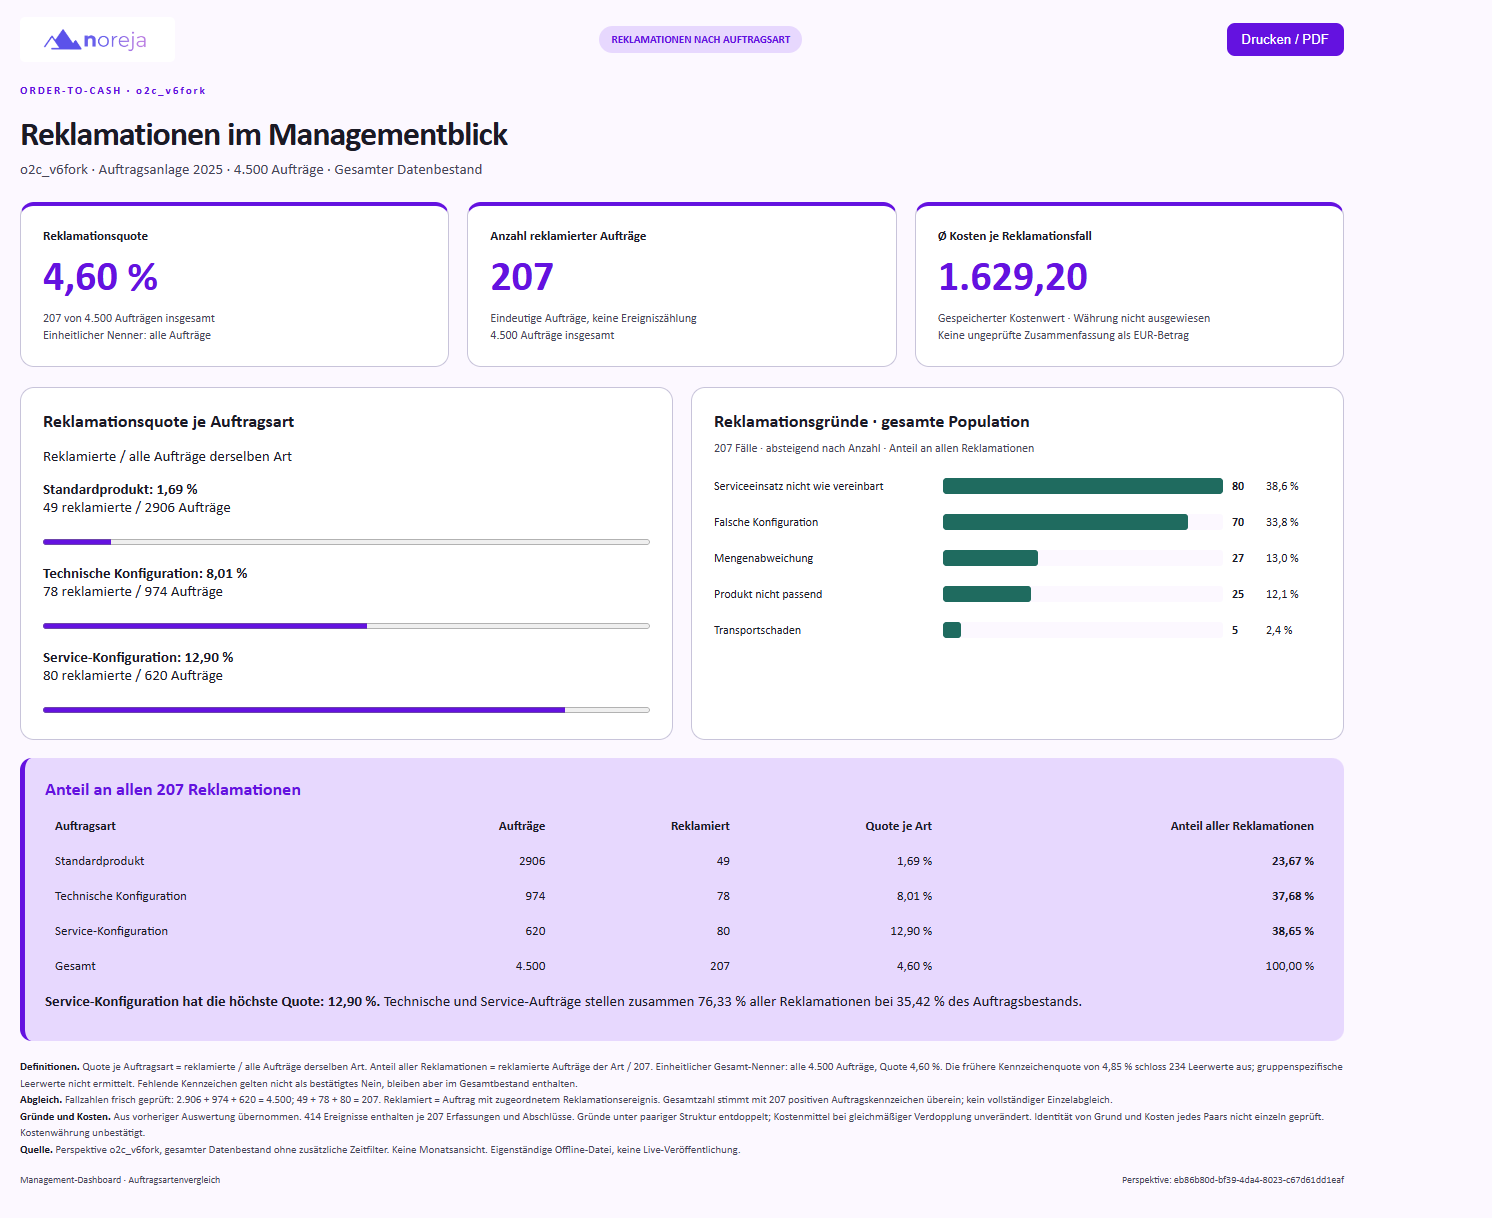
207 of 4,500 orders received a complaint (4.60%). The complaint rate differs markedly by order type, though: from 1.69% for standard products through 8.01% for technical configurations to 12.90% for service configurations.

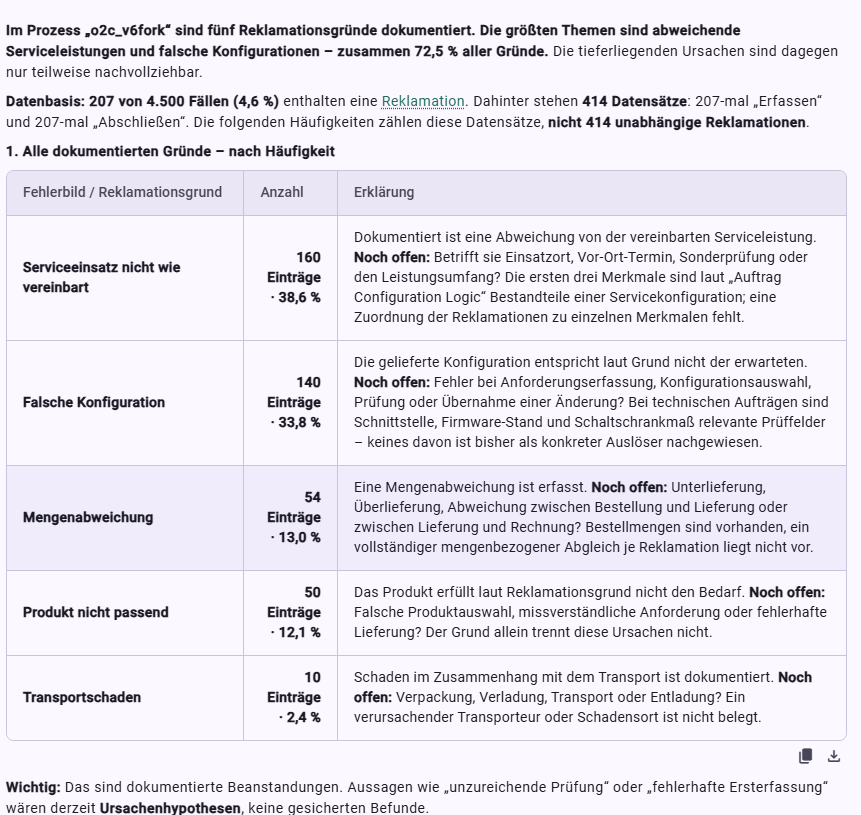
The complaint reasons are concentrated too: “service visit not as agreed” and “wrong configuration” together account for about 72.5% of the documented reasons.

Complaint rate by order type
Order typeOrdersComplaintsRateShare of all complaints
Standard product2,906491.69%23.67%
Technical configuration974788.01%37.68%
Service configuration6208012.90%38.65%
Total4,5002074.60%100%

76.33%

of all complaints come from technical and service configurations – at only 35.42% of the order volume

Instead of “Why do we have 4.6% complaints?”

the analysis asks: “Which order types and characteristics separate risky cases from uncritical ones?”

Management dashboard “complaints at a glance”: complaint rate 4.60% (207 of 4,500 orders), rate by order type – standard product 1.69%, technical configuration 8.01%, service configuration 12.90% – and complaint reasons, led by “service visit not as agreed” and “wrong configuration”
Complaints at a glance: rate by order type and complaint reasons.

Finding 3 · Error pattern

Not every error is a new variant

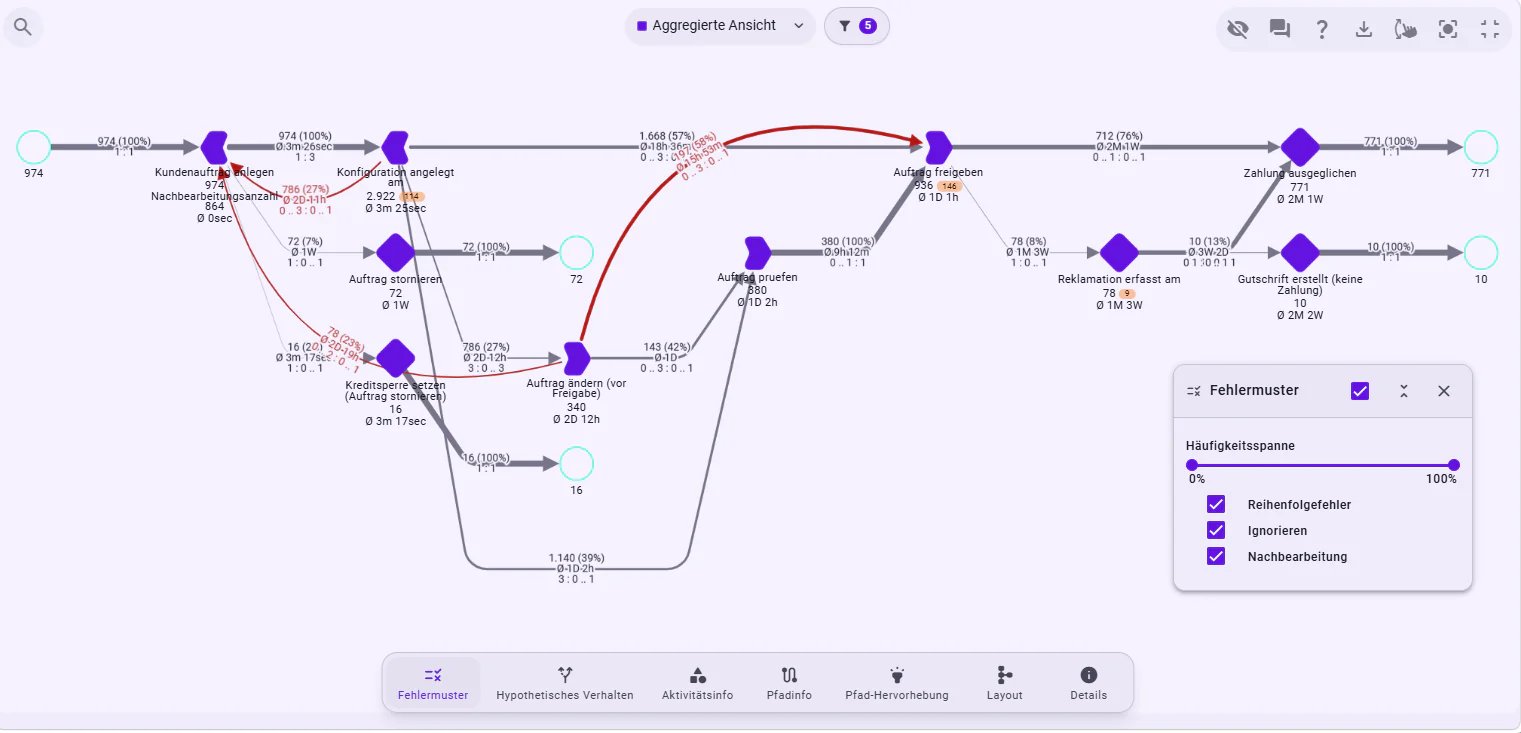
Technical orders follow a clear business rule: if an order is changed before its release, an order review is required afterwards – order change → order review → release. Of 340 changed orders, however, only 143 follow this review path; 197 go straight to release.

Noreja does not treat such deviations as additional process variants but as error patterns. The relevant variants stay manageable while deviations are analysed separately and specifically. In classic event-log-based process mining approaches, by contrast, every deviation quickly appears as a variant of its own – the number of variants grows sharply and the analysis becomes confusing.

The causal perspective describes the expected flow. Error patterns show where this flow is violated – for example by skipping, wrong order, rework, delay, batching or open cases.

197 / 340

technical orders changed before release go straight to release without the intended order review (about 58%)

Instead of “Which new variant is this?”

the analysis asks: “Where is the business logic violated – and why?”

Causal perspective of the 974 technical configuration orders with the error pattern view active: red path from “change order (before release)” straight to “release order” (197 cases, 58%), bypassing the intended “review order” step (143 cases, 42%)
Error pattern “ignore”: after an order change, the intended order review is skipped.

From error pattern to root cause analysis

Business question to Minerva
“Analyse all reasons that lead to a complaint.”

The broad cause analysis deliberately starts open. Minerva structures documented complaint reasons, upstream factors and open hypotheses – and clearly separates documented findings from cause hypotheses.

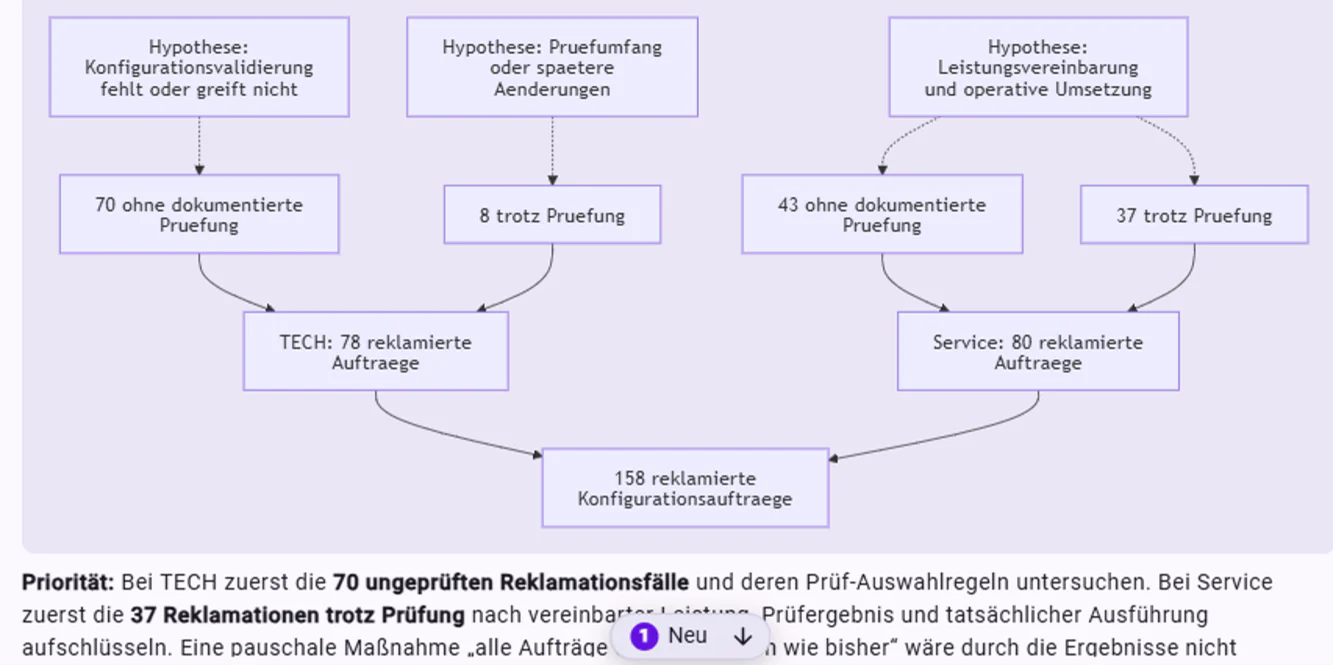
A first focus emerges among the technical configuration orders: of 78 technical orders with complaints, 70 have no documented order review and 8 received a complaint despite a review. For service orders the picture is much less clear – 43 complaints without and 37 despite a review.

The missing review thus becomes a relevant path of analysis – but not yet a proven cause.

Minerva answer on root cause analysis: table of the five documented complaint reasons – service visit not as agreed 38.6%, wrong configuration 33.8%, quantity deviation 13.0%, product not suitable 12.1%, transport damage 2.4% – each with the open cause questions
Minerva structures the documented complaint reasons and separates documented findings from open cause hypotheses.
First picture of causes from Minerva: 158 configuration orders with complaints, of which 78 technical (70 without documented review, 8 despite review) and 80 service (43 without, 37 despite review), each with a hypothesis to be tested
First picture of causes: for technical orders, 70 of 78 complaint cases have no documented review.

Finding 4 · Root cause analysis

The first plausible explanation does not survive the cross-check

The first picture of causes suggests an obvious explanation: changed, unreviewed technical orders receive more complaints. Whether this explanation holds is answered by the next question to Minerva – deliberately kept simple.

Business question to Minerva
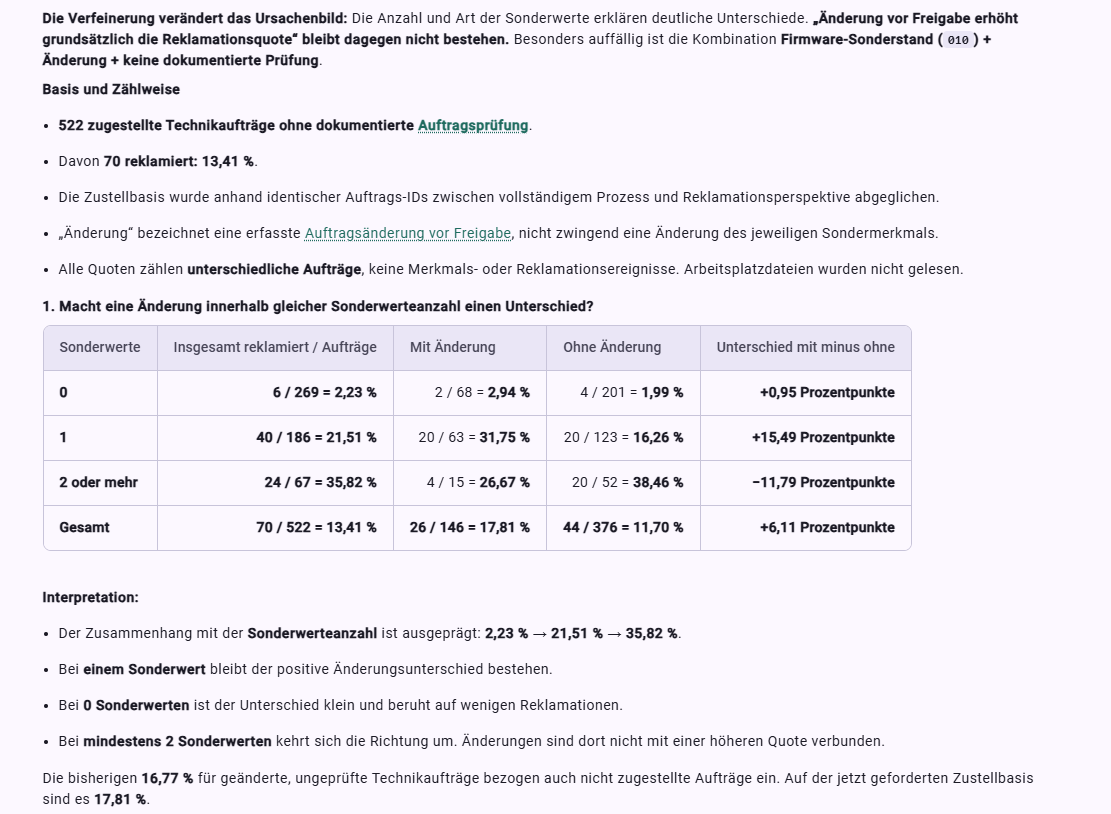
“Analyse the unreviewed technical orders in more detail. What influence do special values and changes before release have on the complaint rate?”
Delivered technical orders without review – complaint rate by special values
Special valuesComplaints / ordersComplaint rate
06 / 2692.23%
140 / 18621.51%
2 or more24 / 6735.82%
Total70 / 52213.41%

2.23% → 35.82%

complaint rate of delivered technical orders without review – from 0 to at least 2 special values

Instead of “Changed orders are risky.”

the analysis asks: “Which orders were already risky because of their configuration?”

Minerva table on 522 delivered technical orders without documented review: complaint rate by number of special values (0: 2.23%, 1: 21.51%, 2 or more: 35.82%), each with and without a change before release
Cross-check: special values separate the risk much more clearly than the blanket change hypothesis.

WHY instead of WHAT: which special feature stands out

The number of special values clearly separates the risk. The blanket statement “change = risk”, by contrast, does not generally survive the cross-check: with exactly one special value the rate is higher with a change than without, with two or more special values the direction reverses.

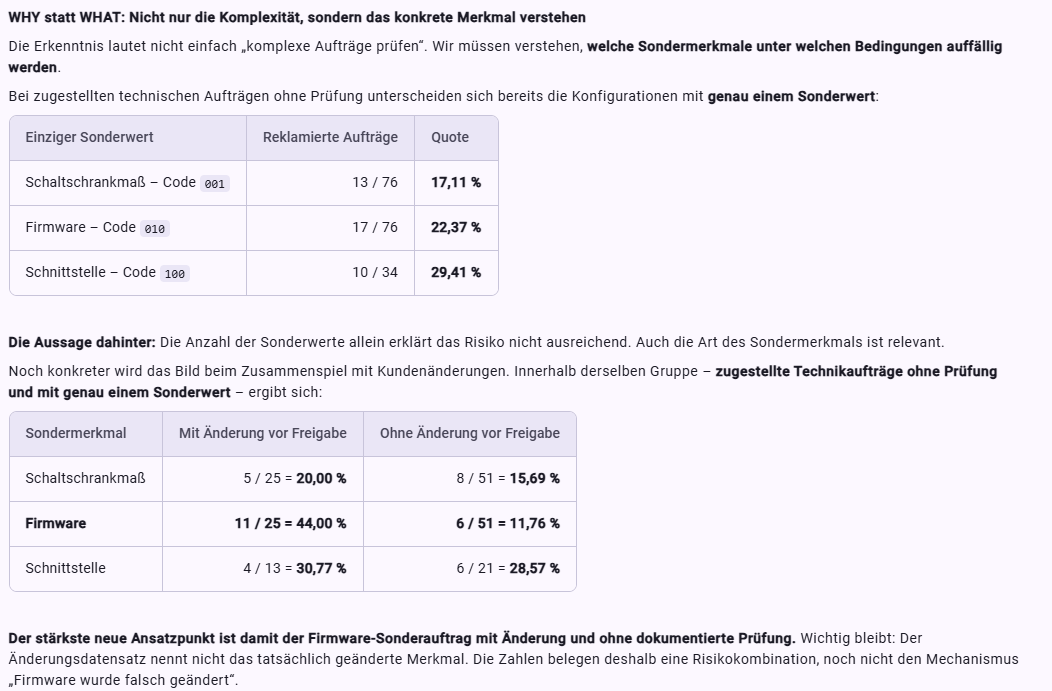
A further drill-down shows that the type of special feature matters too. The combination of a special firmware version, a change before release and a missing review stands out in particular: 11 of 25 of these orders received a complaint (44.00%), compared with 6 of 51 without a change (11.76%).

Drill-down on individual special features with exactly one special value: control cabinet dimensions 17.11%, firmware 22.37%, interface 29.41%; firmware with a change before release 44.00% versus 11.76% without a change
WHY instead of WHAT: not only the number but also the type of special feature matters.
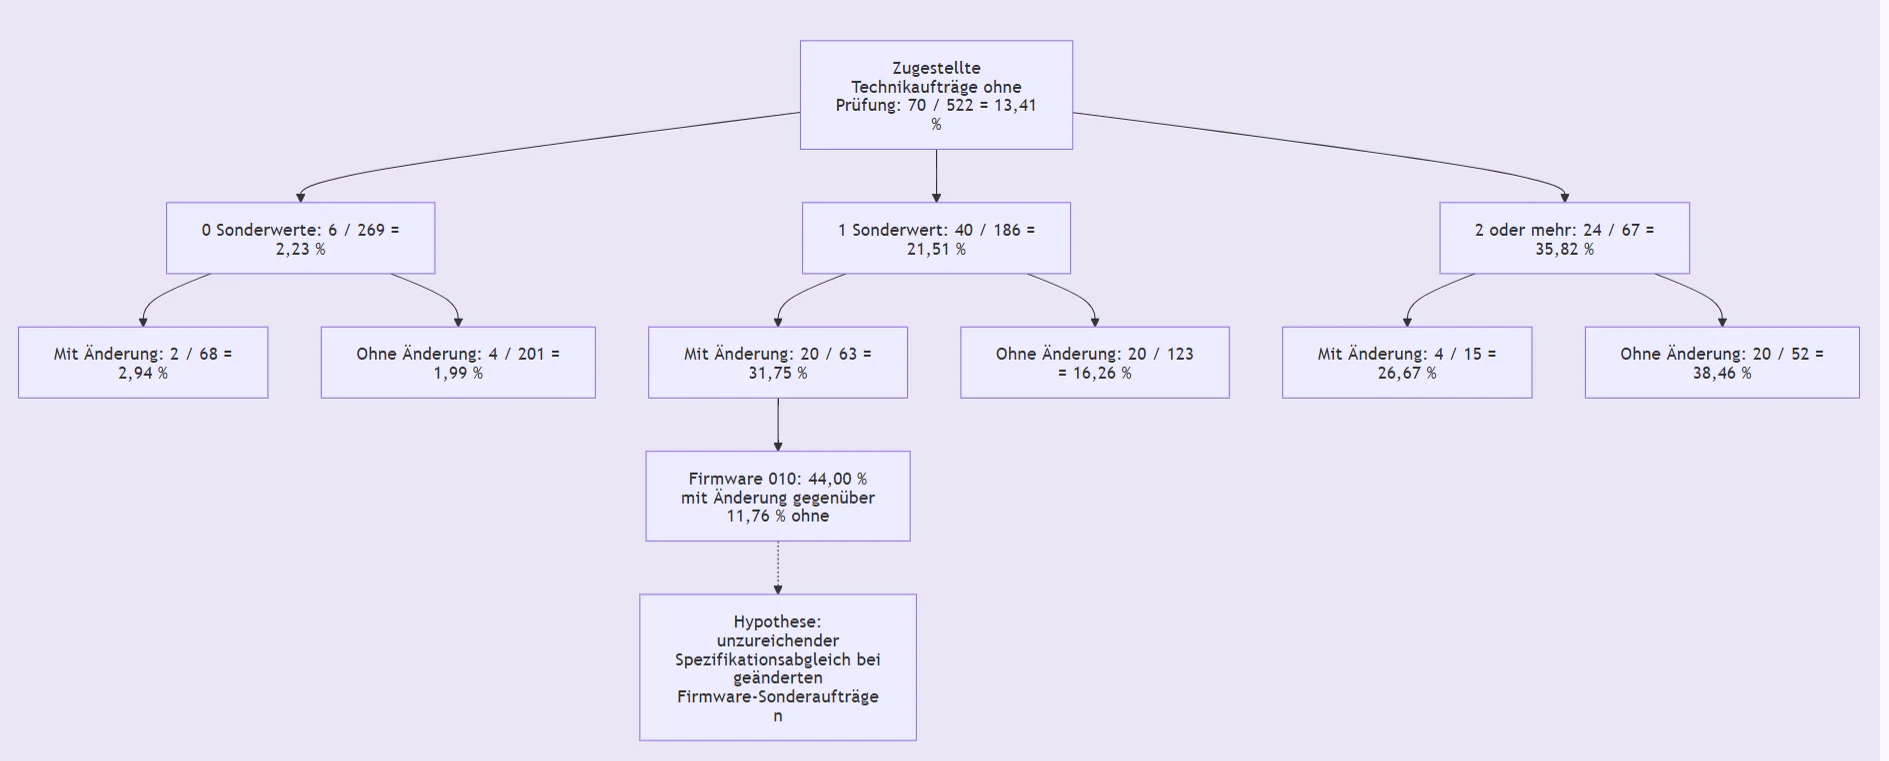
Hypothesis tree: delivered technical orders without review (13.41%) split by 0, 1 and at least 2 special values and with or without a change; with one special value the branch leads to the firmware constellation (44.00% with a change) and to the hypothesis of an insufficient specification check
Refined picture of causes: the firmware constellation is deliberately marked as a hypothesis still to be tested.

Finding 5 · Review rule

From cause to a risk-based review rule

For the management decision, what ultimately counts is not only the explanation but the question of when a review actually makes sense.

For technical orders without a special value, these data show no quality benefit from an additional review. From one special value onwards, however, reviewed and unreviewed orders differ clearly. The difference also matters economically: in the demo dataset, the stored effort of a complaint is well above that of a single review.

≥ 1 special value

as the criterion for a prioritised review of technical orders – without a special value the data show no quality benefit from an additional review

Instead of “How do we reach the highest possible touchless rate?”

the analysis asks: “When does a review protect quality – and when can an order run through without intervention?”

A testable decision hypothesis

The analysis does not produce a blanket rule but a hypothesis that can be measured in a pilot:

  • Keep the existing obligation

    If an order is changed before release, the intended review remains in place.

  • Add risk-based reviews

    Technical orders with at least one special value are additionally reviewed with priority.

  • Use the automation potential

    Technical orders without a special value can more readily run through without an additional review, provided there is no other reason for one.

Why AI needs causal process mining

Generative AI can summarise patterns and formulate measures quickly. For process automation, however, speed alone is not enough.

Process data alone does not carry meaning

System data shows values and events. It does not automatically explain what a characteristic means in business terms or which company rule lies behind it.

Company context adds this meaning. Causal process mining then tests how characteristics, process behaviour and outcomes are related. Minerva connects these levels in dialogue and makes the analysis accessible to the user.

Process data provides the facts. Company context provides the meaning. Causal process mining tests the cause hypotheses.

Automating on the basis of the right analysis

Four things are decisive for AI-supported process decisions: the right business granularity, relationships between business objects, company context and an analysis that does not prematurely read correlations as causes.

Automating a process on the basis of the wrong analysis does not make it better – only wrong faster.

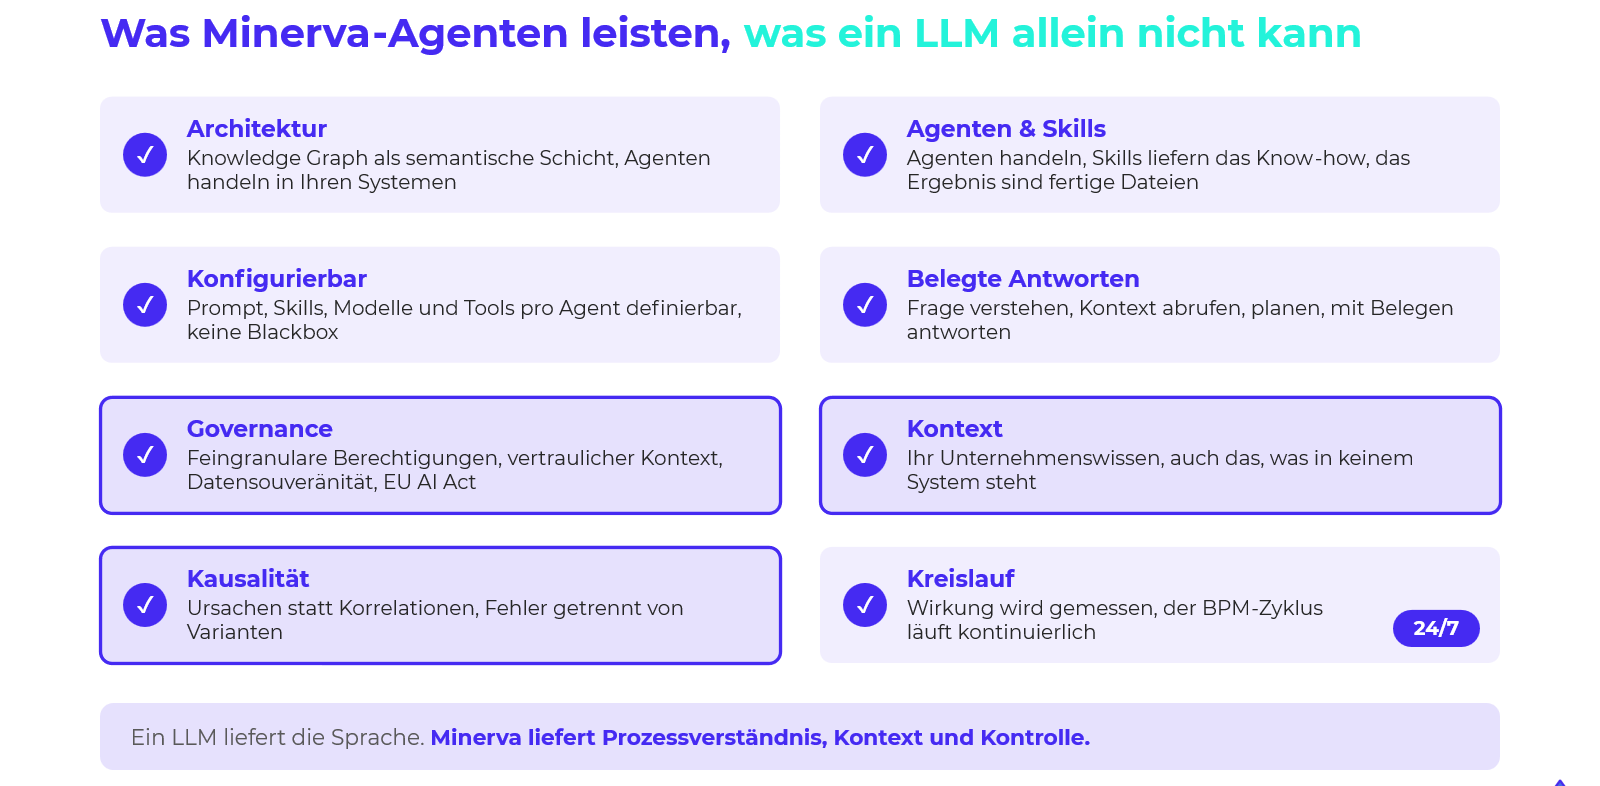
Overview “What Minerva agents do that an LLM alone cannot”: architecture, agents and skills, configurability, evidenced answers, governance, context, causality and a continuous 24/7 loop
What Minerva agents do that an LLM alone cannot (in German).

Causal process mining provides the analytical foundation. Minerva makes it usable in dialogue.

From finding to prioritised measure

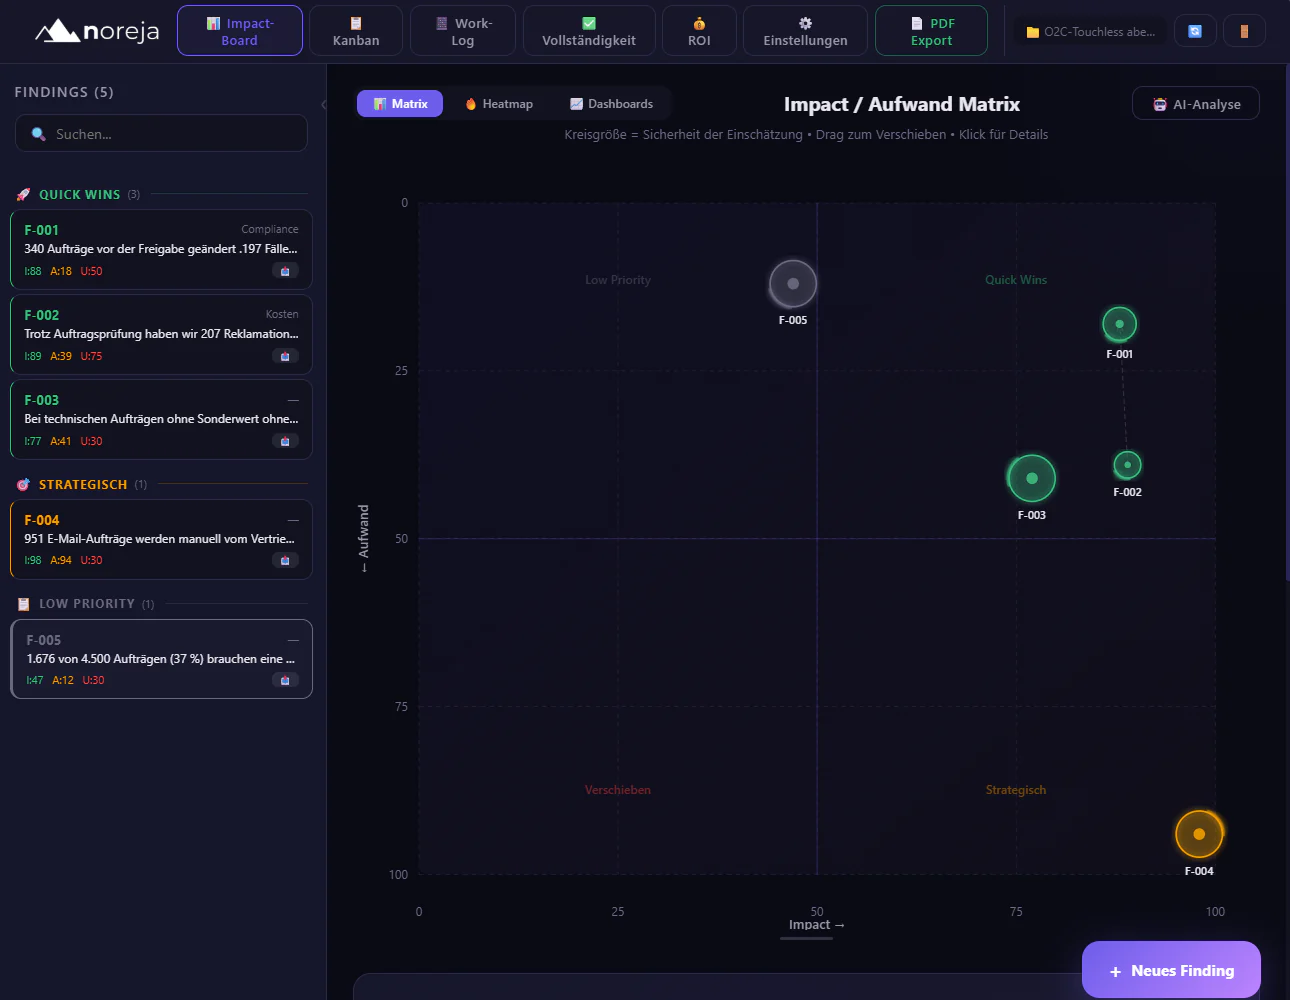
A finding does not change a process yet. In the Business Impact Board, findings are rated by expected impact, implementation effort, risk and uncertainty – process excellence and the business then prioritise the next improvement initiative together.

Possible improvement directions
FindingPossible improvement directionImpact to assess
Review after changes is often skippedEnforce the existing review rule more consistently and investigate why it is skippedQuality, compliance, complaint risk
Special configurations show much higher risksPrioritise technical orders with at least one special value for a risk-based reviewComplaint rate, quality, review effort
Low-risk orders without a special valueReduce additional reviews specifically and test this as a pilotTouchless rate, lead time, degree of automation
Firmware constellation particularly conspicuousInvestigate the hypothesis further in a targeted wayQuality, complaint risk, uncertainty
Service complaints stay high despite reviewInvestigate a separate cause pathService quality, customer satisfaction
Business Impact Board with five O2C findings in the impact/effort matrix: three quick wins, one strategic finding and one with low priority
Business Impact Board: findings placed by impact and effort.
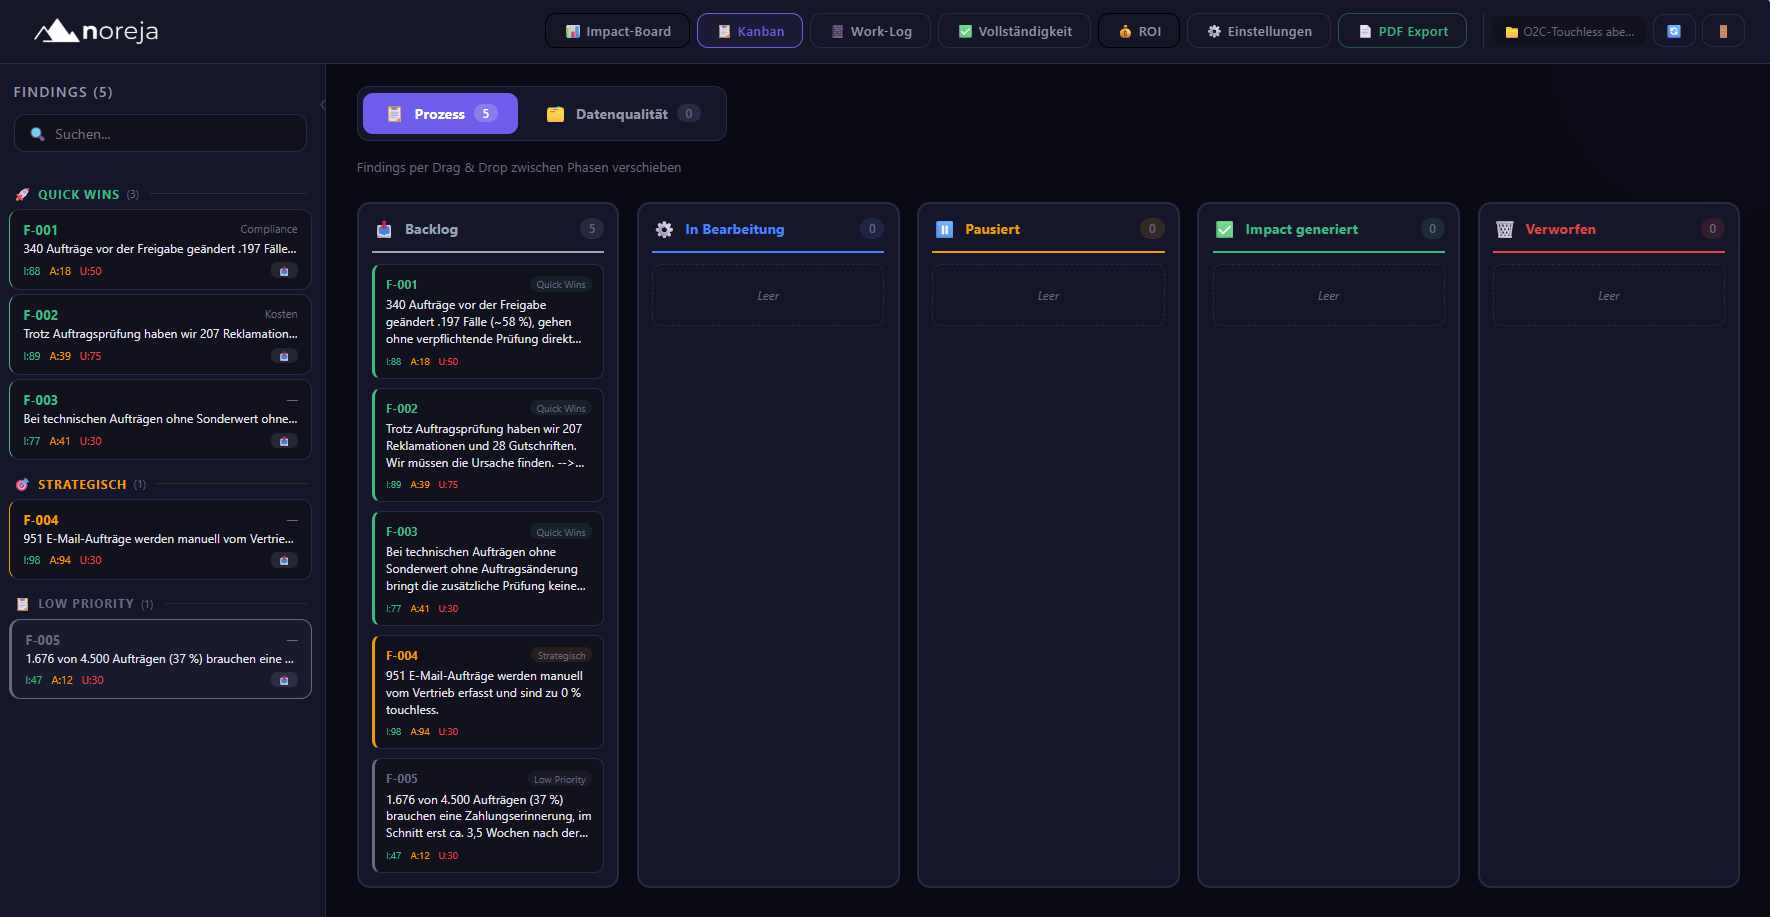
Kanban view of the Business Impact Board with the columns backlog, in progress, paused, impact generated and discarded; all five findings in the backlog
Kanban: findings move from the backlog to “impact generated”.
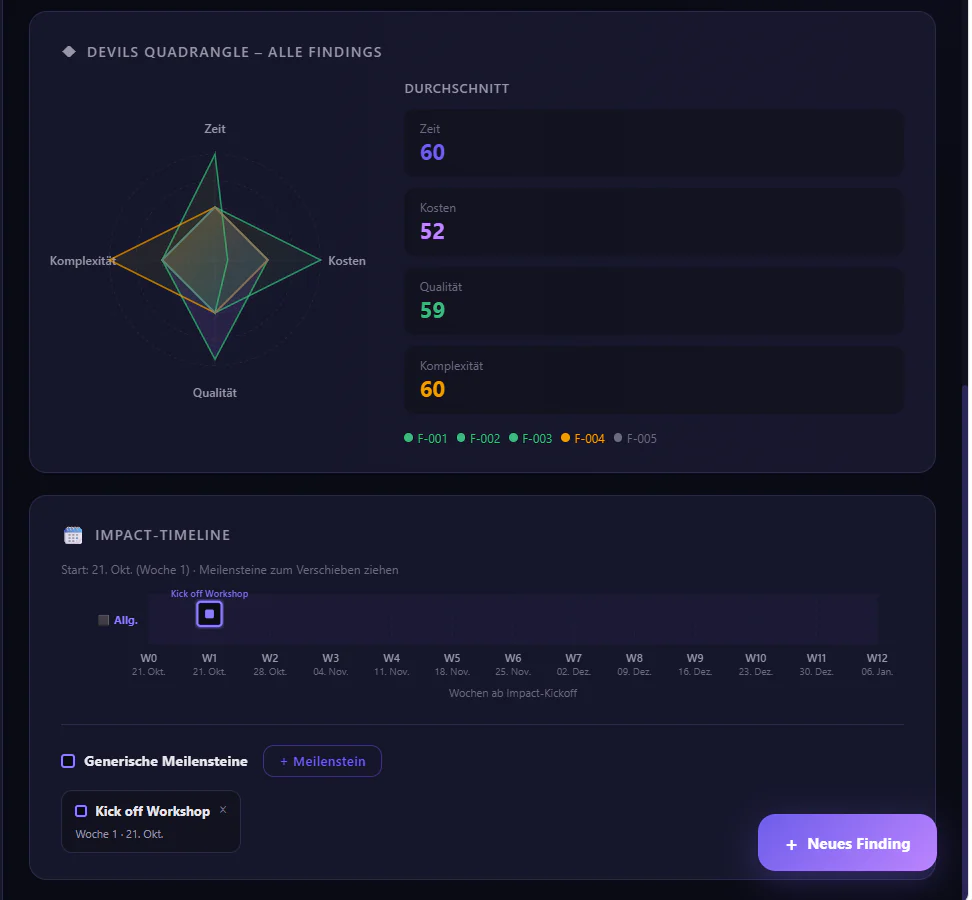
Devil’s Quadrangle across all findings with the dimensions time, cost, quality and complexity, and an impact timeline with the kick-off workshop as the first milestone
Devil’s Quadrangle and impact timeline for the findings.
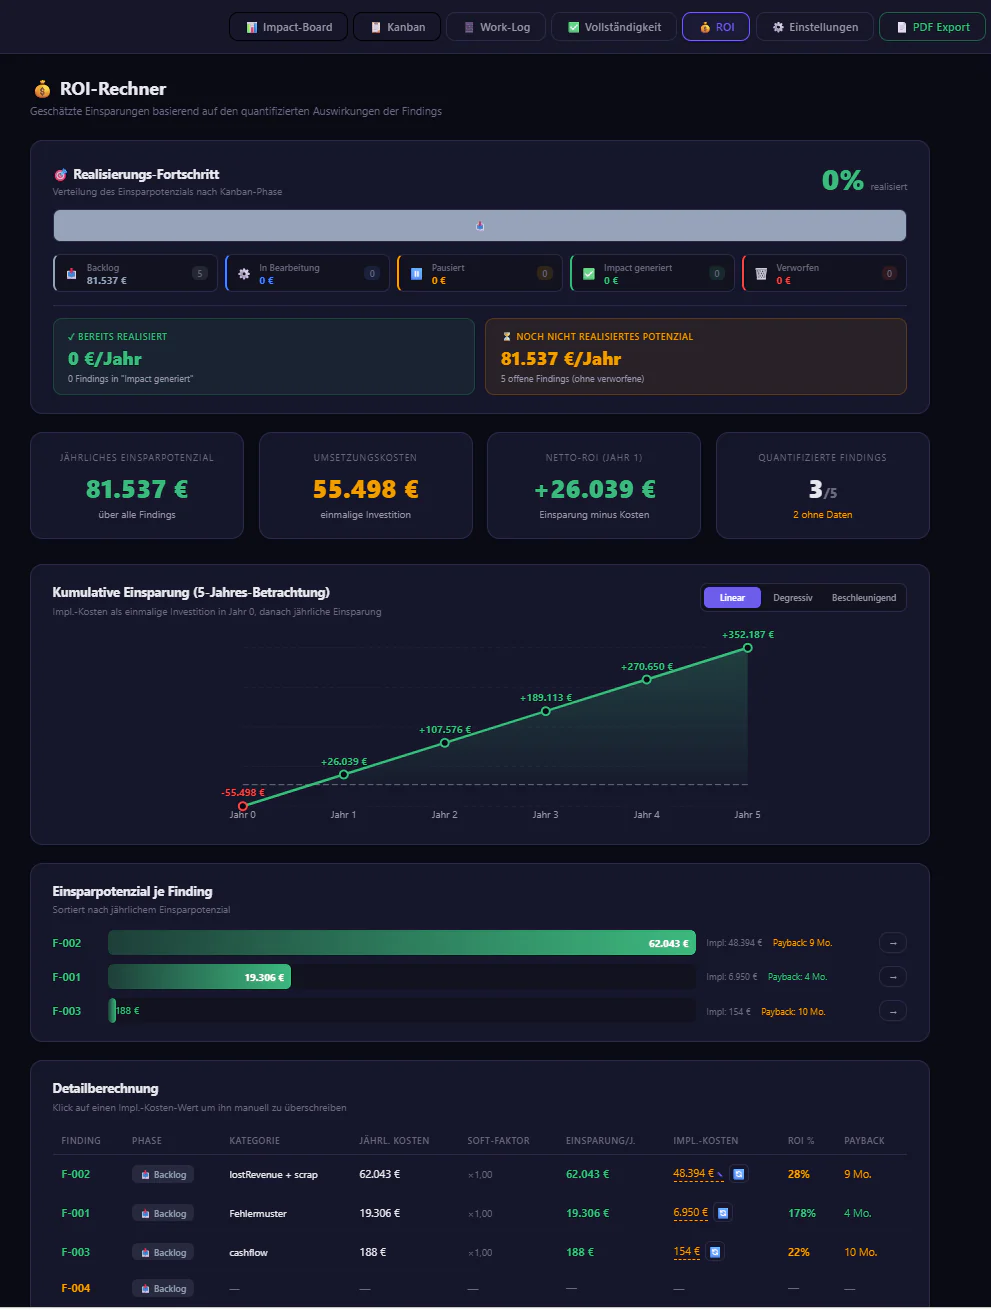
ROI calculator in the Business Impact Board: annual savings potential, implementation cost, net ROI in year one, cumulative savings over five years and savings potential per finding
ROI calculator: savings potential, implementation cost and payback per finding – values from the demo dataset.

Prioritisation is a business decision. Minerva can prepare analysis paths, context and options; control and decision-making authority stay traceably with the process owner and the business at all times.

The loop: Insight → Action → Impact → Feedback

After prioritisation, a measure is implemented as a pilot and its effect is measured again against the same process data. Minerva Frontier Agents can accompany this loop continuously: spotting new findings, developing hypotheses further and observing the effect of implemented measures.

  1. 1

    Insight

    Special configurations show different risk profiles; “change = risk” is not enough as an explanation.

  2. 2

    Action

    Keep mandatory reviews and prioritise technical special configurations on a risk basis.

  3. 3

    Impact

    Measure touchless rate, complaint rate, OTIF and cost again.

  4. 4

    Feedback

    If the expected effect is not confirmed, the hypothesis is adjusted.

Check after every measure

  • Does the touchless rate rise for low-risk orders without a special value?
  • Does the complaint rate fall for technical special configurations?
  • Is the review after order changes carried out more consistently?
  • Does the OTIF rate stay stable or improve?
  • Are review effort and avoided complaint costs in a sensible proportion?
  • Is the hypothesis confirmed – or does it need adjusting?

Four principles behind the analysis

Keep granularity

Business objects and their relationships are preserved instead of reducing the process up front to a single linear case logic.

Start with the business question

The causal perspective is built for the concrete business question – the operating logic of the tool does not drive the analysis.

Separate error patterns from causes

A visible deviation is a starting point for analysis, not yet a root cause.

Include context

System data shows values; company context explains what they mean in business terms.

Conclusion: touchless alone is no control logic

A high touchless rate alone is not a sufficient control logic. What matters is where a manual intervention adds no value and where it protects a risky order from a later quality problem.

Causal process mining connects the business target logic, observed error patterns, company context and targeted cross-checks. In the O2C example this corrects an initially plausible explanation: it is not the change alone that separates good from bad cases, but above all the risk profile of the special configuration.

“More touchless” thus becomes a more concrete course of action: automate low-risk orders more, review technical special configurations specifically, and then measure whether the rule actually improves quality and efficiency.

Understand. Prioritise. Automate effectively. Protect quality.

Frequently asked questions about Order-to-Cash

What is an order-to-cash process?

Order-to-cash (O2C) is the end-to-end process from order entry to payment clearing. It covers order capture, configuration and release, delivery and invoicing, payment and dunning, and complaints and rework. In the operational data O2C is not a linear flow but a network of business objects such as customer order, item, configuration, delivery, invoice, payment and complaint.

What does touchless mean in order-to-cash?

An order counts as touchless when it runs through the process without manual intervention. The touchless rate measures the share of such orders – 46.37% in the synthetic demo dataset, i.e. 1,978 of 4,266 consistently assessable customer orders.

Should the touchless rate be as high as possible?

Not at any price. Some manual steps only cost time, others prevent costly errors. In the O2C example, the complaint rate of unreviewed technical orders rises markedly with the number of special values. What matters is therefore which orders need a human and which do not: as much touchless as possible, as much effective review as necessary.

What does the OTIF rate measure?

OTIF stands for “on time in full”: an order was delivered on schedule and complete. In the demo dataset, 3,708 of 4,266 consistently assessable orders meet this criterion – an OTIF rate of 86.92%.

Why does Noreja treat deviations as error patterns rather than variants?

In event-log-based approaches every deviation quickly appears as a variant of its own; the number of variants grows and the analysis becomes confusing. Noreja describes the expected flow in the causal perspective and classifies violations – such as skipping, wrong order or rework – as error patterns. In the O2C example, 197 of 340 technical orders changed before release go straight to release without the intended review.

Is an error pattern already the cause of a problem?

No. An error pattern shows where the expected flow is violated. It is the starting point of root cause analysis, not its result. In the O2C example the missing review is first a relevant path of analysis – only the cross-check shows that it is above all the risk profile of the special configuration that separates good from bad cases.

Why is a change before release not automatically the cause of complaints?

Because the cross-check does not generally confirm the blanket hypothesis. For delivered technical orders without review, the complaint rate rises above all with the number of special values – from 2.23% without a special value to 21.51% with one and 35.82% with two or more. Within the same number of special values, the change shows no consistent picture.

What role does the AI assistant Minerva play?

Minerva answers business questions in dialogue, structures complaint reasons, forms comparison groups and separates documented findings from cause hypotheses. It connects process data, company context and causal process mining. The decision about measures stays with the process owner and the business.

Why does AI need causal process mining?

Generative AI can summarise patterns quickly but does not by itself distinguish correlation from cause. AI-supported process decisions need the right business granularity, relationships between business objects, company context and an analysis that tests cause hypotheses. Automating a process on the basis of the wrong analysis only makes it wrong faster.

How does a finding become a measure?

In the Business Impact Board, findings are rated and prioritised by expected impact, implementation effort, risk and uncertainty. The chosen measure is implemented as a pilot; afterwards touchless rate, complaint rate, OTIF and cost are measured again with the same process data.

Are the figures from a real company?

No. All figures come from a synthetic order-to-cash dataset. They illustrate the analysis method and are not production figures of any customer.
The full case description

Event knowledge graph, end-to-end causal perspective, all five findings with their analysis steps, the root cause analysis with Minerva and the path to a risk-based review rule – step by step in the Noreja Help Center (in German).

Read the case in the Help Center

Want to analyse your own process? Talk to us.

Ready to Start

Understand your end-to-end process causally — talk to us

Join companies that are redefining growth and efficiency with intelligent process analysis.