End-to-end process · Surgical patient pathway in hospitals

Admission-to-Discharge

How causal process mining reveals hidden causes between the ward, the recovery room and the operating room.

The symptom shows in the OR. The cause lies elsewhere.

Many OR initiatives pursue the same goals: more predictable schedules, better utilisation of the operating rooms and fewer delays or cancellations. On-time starts, turnover times and OR holds look like the obvious levers.

Yet in the perioperative process, delays often arise somewhere else entirely: in incomplete preparation on the ward, in a missing bed after the recovery room, or in a backlog at shared resources.

The problem becomes visible in the OR. The cause often lies elsewhere. Optimising only the OR treats the symptom.

What is Admission-to-Discharge?

Admission-to-discharge describes a patient’s path through the hospital, from admission to discharge. This case looks at the surgical patient pathway, also called the perioperative patient pathway: the end-to-end process around a surgical procedure with preoperative preparation and clearance, patient call-up and transport, anaesthesia induction and surgery, emergence and leaving the operating room, care in the recovery room (PACU) and the transfer to a ward or the intensive care unit. On a process slide the flow looks linear. In reality, several patients, teams and shared resources interlock: an operating room waits for a patient, a patient for complete preparation, a PACU bay for the transfer of the previous patient – and that patient for a free bed on the ward. Causal process mining preserves this granularity and the relationships between patient, surgery, operating room, PACU, bed and ward.

Note: the figures on this page come from a synthetic perioperative dataset of 2,400 surgical cases. They illustrate the analysis method and are not production figures of any hospital. Apart from the event knowledge graph, the screenshots show the German user interface.

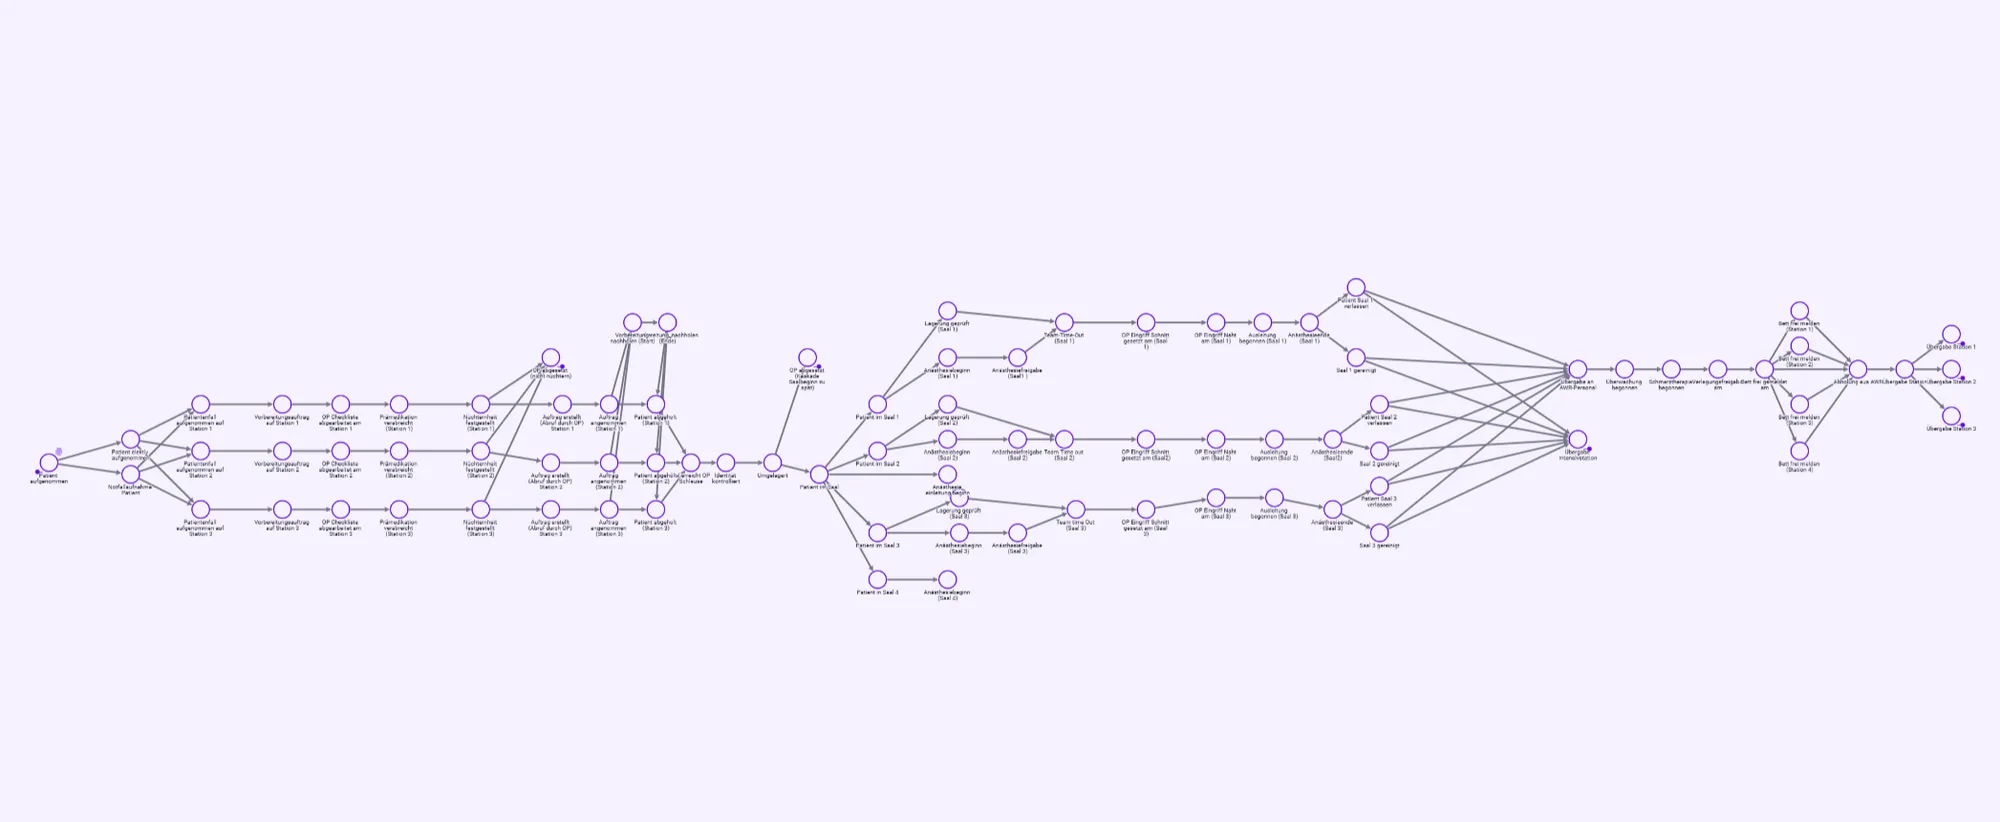
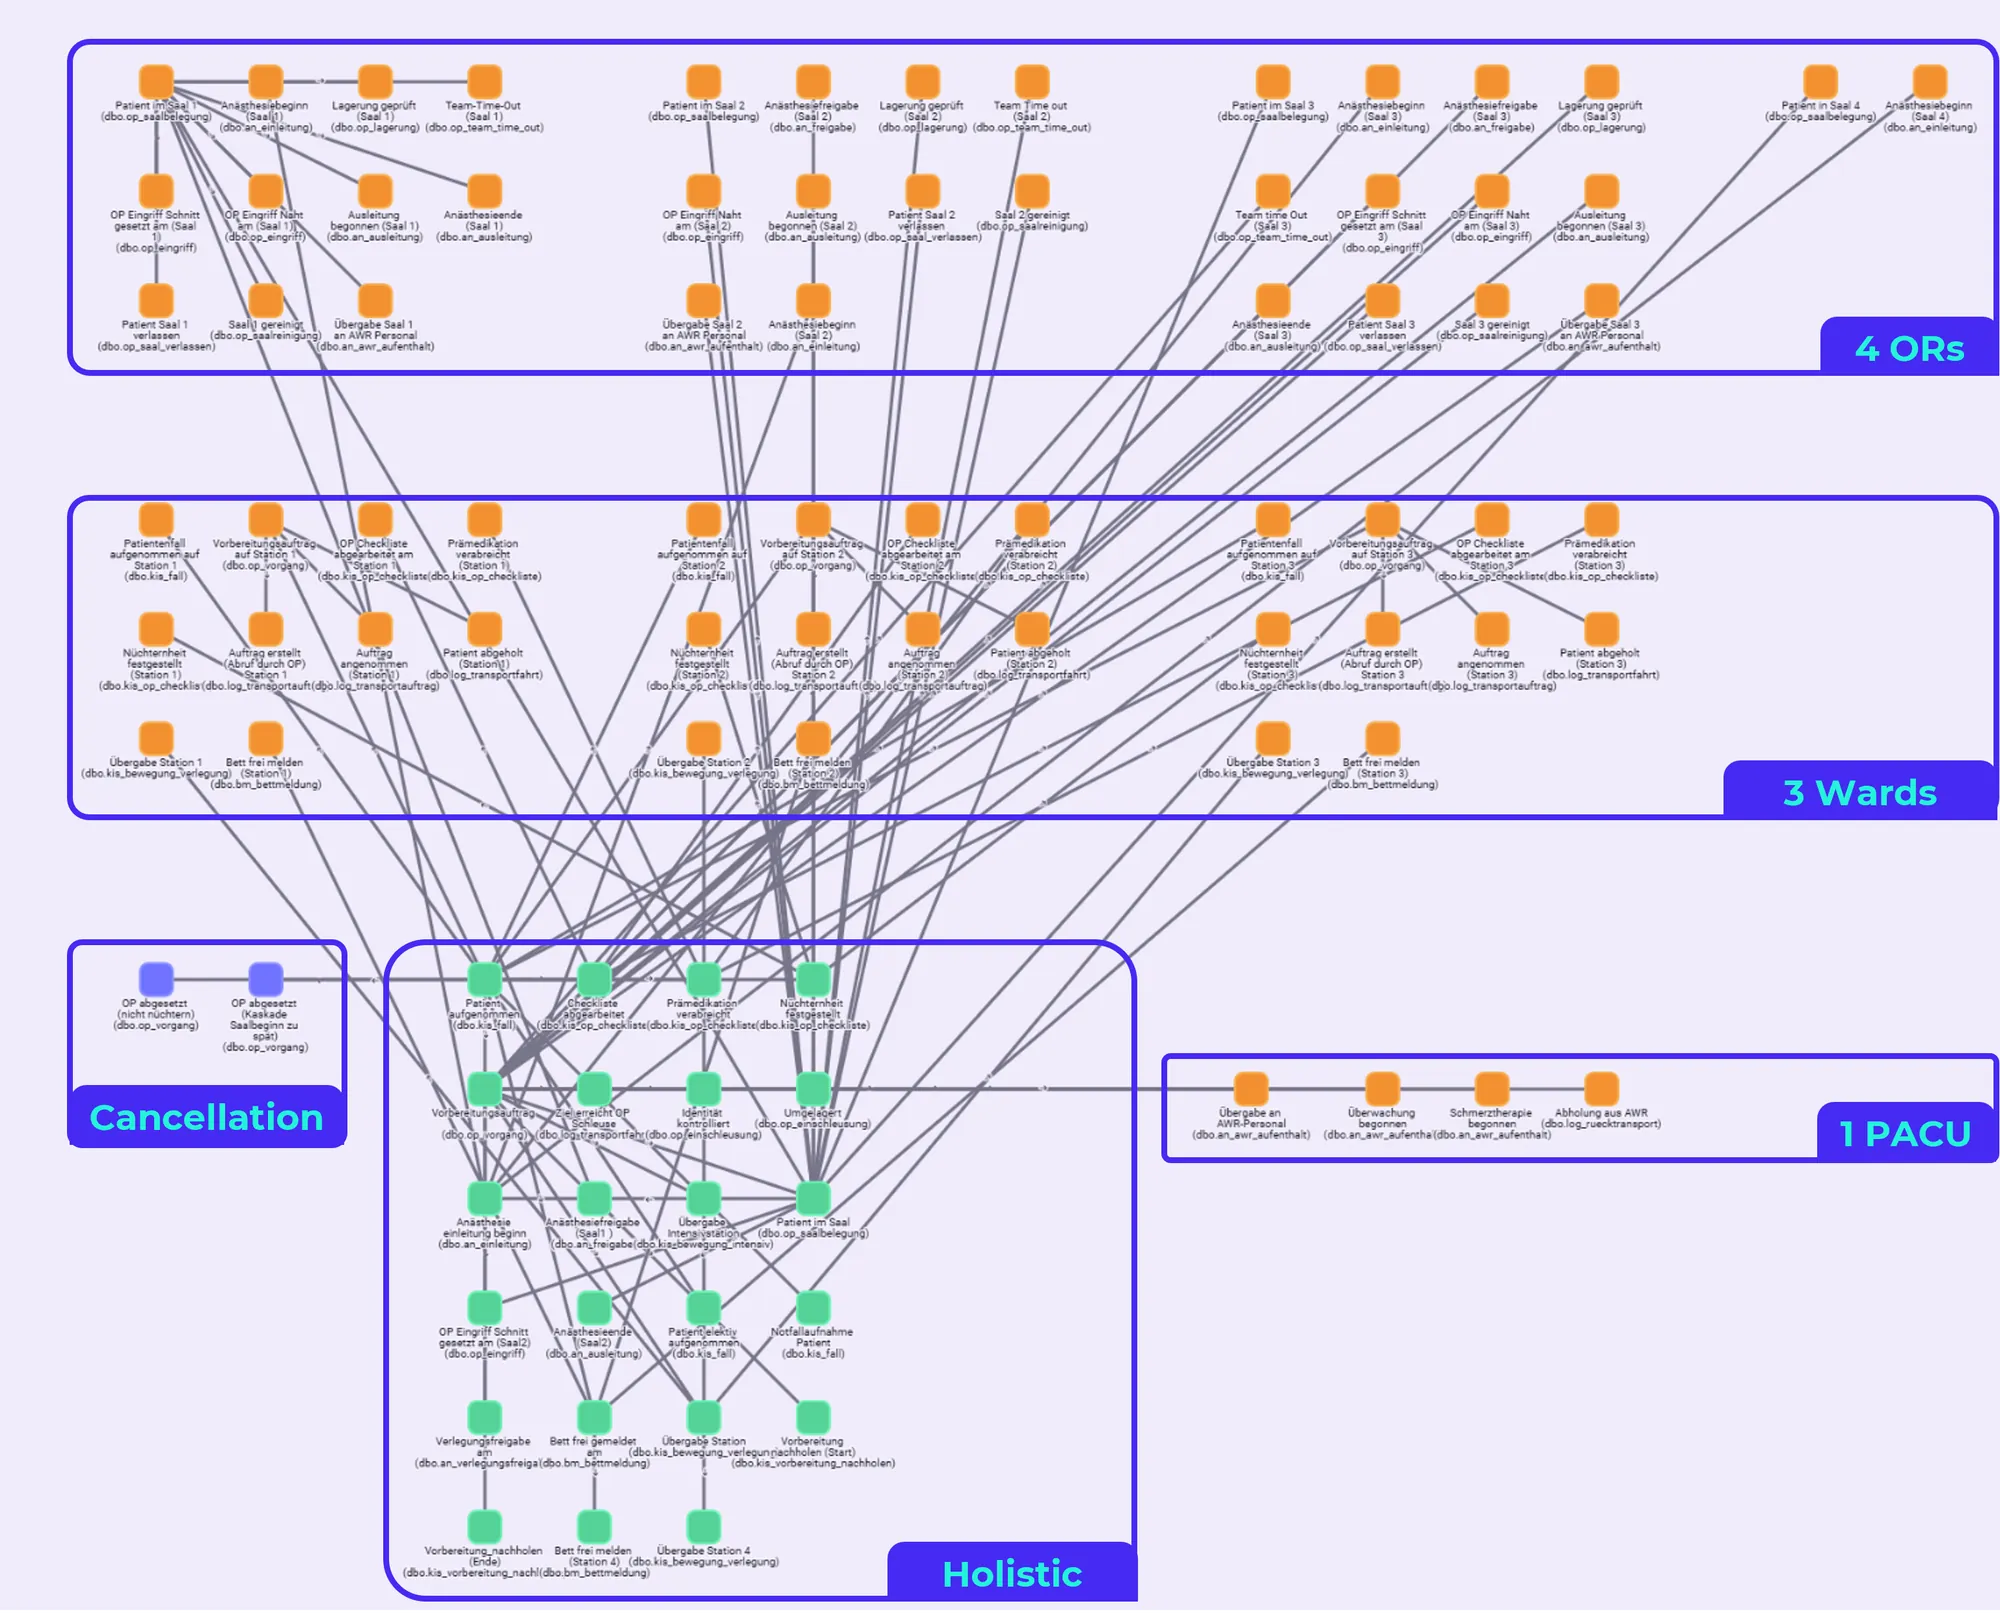
Event knowledge graph of the surgical patient pathway: activities from 26 tables grouped into four operating rooms, three wards, one PACU, cancellations and the holistic cross-cutting activities – from patient admission, checklist, premedication and fasting status through patient in the operating room and anaesthesia to transfer clearance, bed release and handover to the ward
Event knowledge graph of the OR process: patient, surgical case, operating room, PACU, bed and ward stay connected – complexity is reduced during analysis, not already at data import.

At a glance

67.2%

First cases on time

OR entry within 15 minutes of the planned time

431

OR holds

the patient cannot leave the OR because the PACU is full

143

Cancelled procedures

107 for lack of time, 36 because the patient was not fasting

374.1 h

Blocked OR capacity

cumulative hold time; not automatically avoidable one to one

514

Surgeries leaving the OR after 15:30

overrun beyond the planned end of the OR day

752

Preparations completed late

31.3% of all surgical cases, about 45 minutes on average

2,400

Surgical cases

entire synthetic dataset

26

Tables from 5 systems

combined in one event knowledge graph in the demo setup

The process in three blocks

The end-to-end causal perspective connects ward, operating room, PACU and bed in one business view. Only for the concrete business question is a matching causal perspective derived from it – for example end-to-end, preparation, surgery, PACU and bed release, or the OR day.

End-to-end causal perspective of the perioperative patient pathway: from elective or emergency admission through preparation on three wards, patient call-up, OR transfer area and transfer to the table, the flows in the operating rooms and the handover to PACU staff or the intensive care unit, to transfer clearance, bed release, collection from the PACU and handover to the ward
End-to-end causal perspective of the surgical patient pathway from the ward through the OR to the transfer.

Phase 1

Preoperative preparation & patient call-up

The patient is prepared on the ward: informed consent, lab tests, premedication and checklist. Only when all prerequisites are met can the patient be called up and transported. If steps are missing, they are completed at short notice – and the patient reaches the operating room later.

Business objects

  • Patient
  • Surgical case
  • Ward
  • Preoperative preparation
  • Checklist
  • Informed consent
  • Lab tests
  • Premedication
  • Patient transport
  1. Case admitted on ward
  2. Preparation order
  3. Surgical checklist completed
  4. Premedication given
  5. Fasting status confirmed
  6. Call-up by the OR
  7. Patient collected
  8. OR transfer area & identity check
  9. Patient in OR

Guiding question

Which preparatory steps prevent an on-time patient call-up – and which of them can be completed earlier or more reliably?

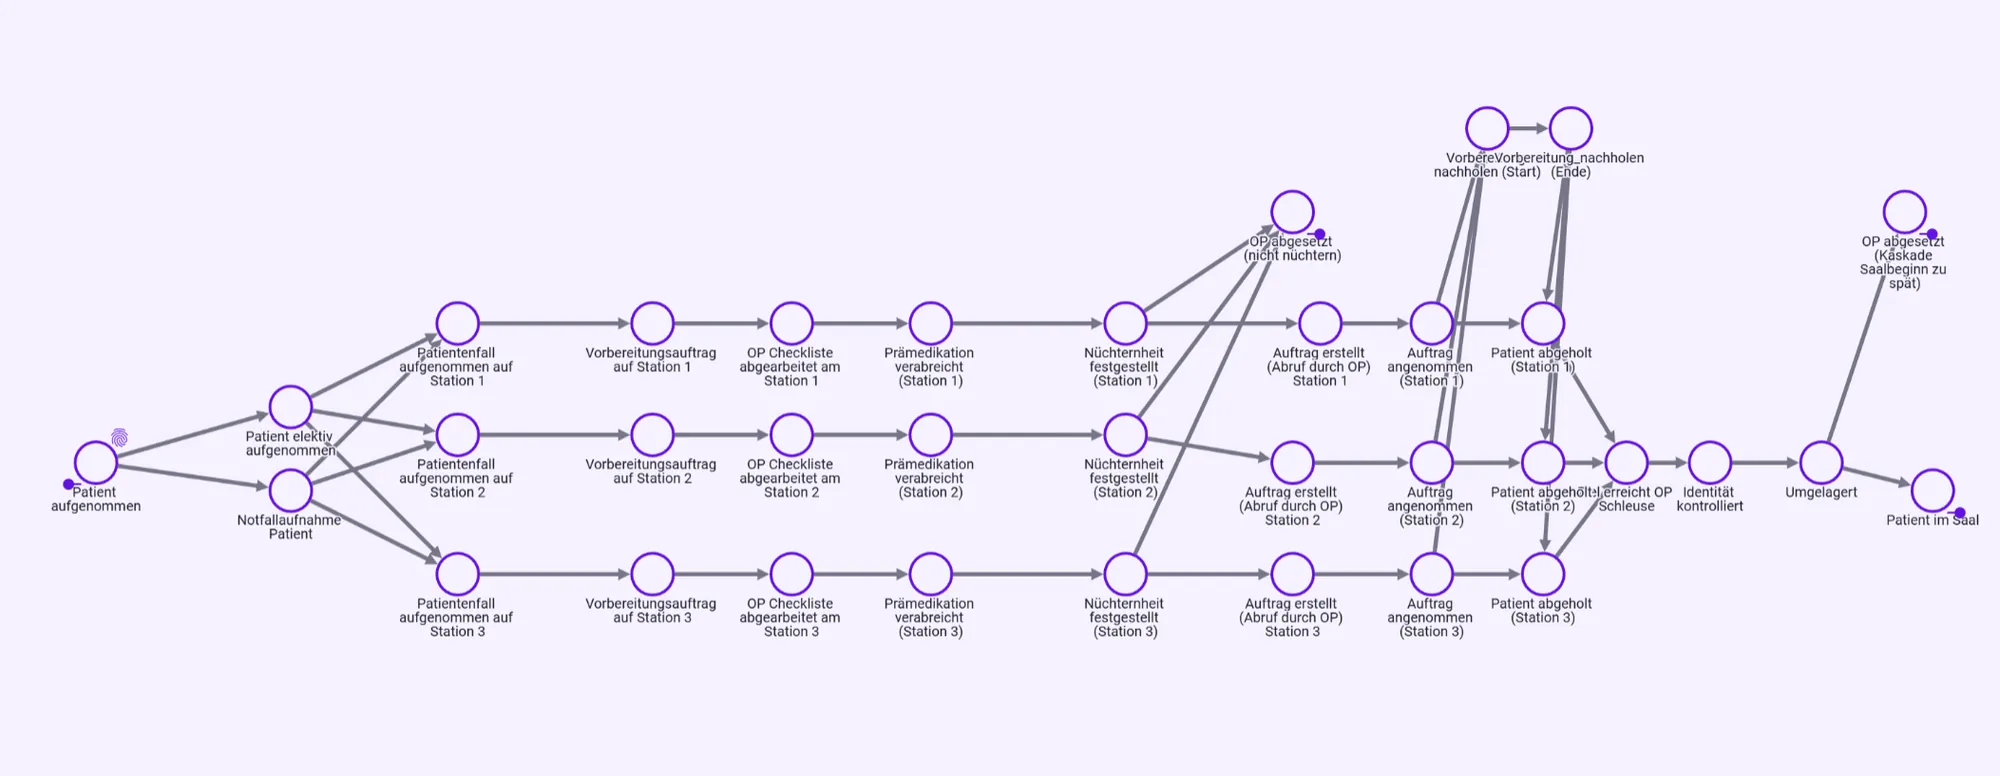
Causal perspective of preoperative preparation: elective or emergency admission, then per ward 1 to 3 the patient case, preparation order, surgical checklist, premedication, fasting status, call-up by the OR and patient collected, followed by OR transfer area, identity check, transfer to the table and patient in OR; branching off are “complete preparation later” and the cancellations for missing fasting and a late OR start
Preoperative preparation, patient call-up, transport and preparation steps completed late.

Phase 2

Induction, surgery & OR control

Patient, operating room, anaesthesia team and surgical team come together. Induction and surgery are followed by emergence, leaving the room and the turnover to the next patient. If an early case is delayed, the deviation can build up across all following surgeries of the OR day.

Business objects

  • Patient
  • Surgical case
  • Operating room
  • Anaesthesia team
  • Surgical team
  • Specialty
  • Preceding and following procedure
  1. Patient in OR
  2. Positioning checked
  3. Anaesthesia start
  4. Anaesthesia release
  5. Team time-out
  6. Incision
  7. Suture
  8. Emergence
  9. Anaesthesia end
  10. Patient leaves OR
  11. OR cleaned

Guiding question

Does the delay really arise in the operating room – or do we only see the effect of a cause that arose earlier?

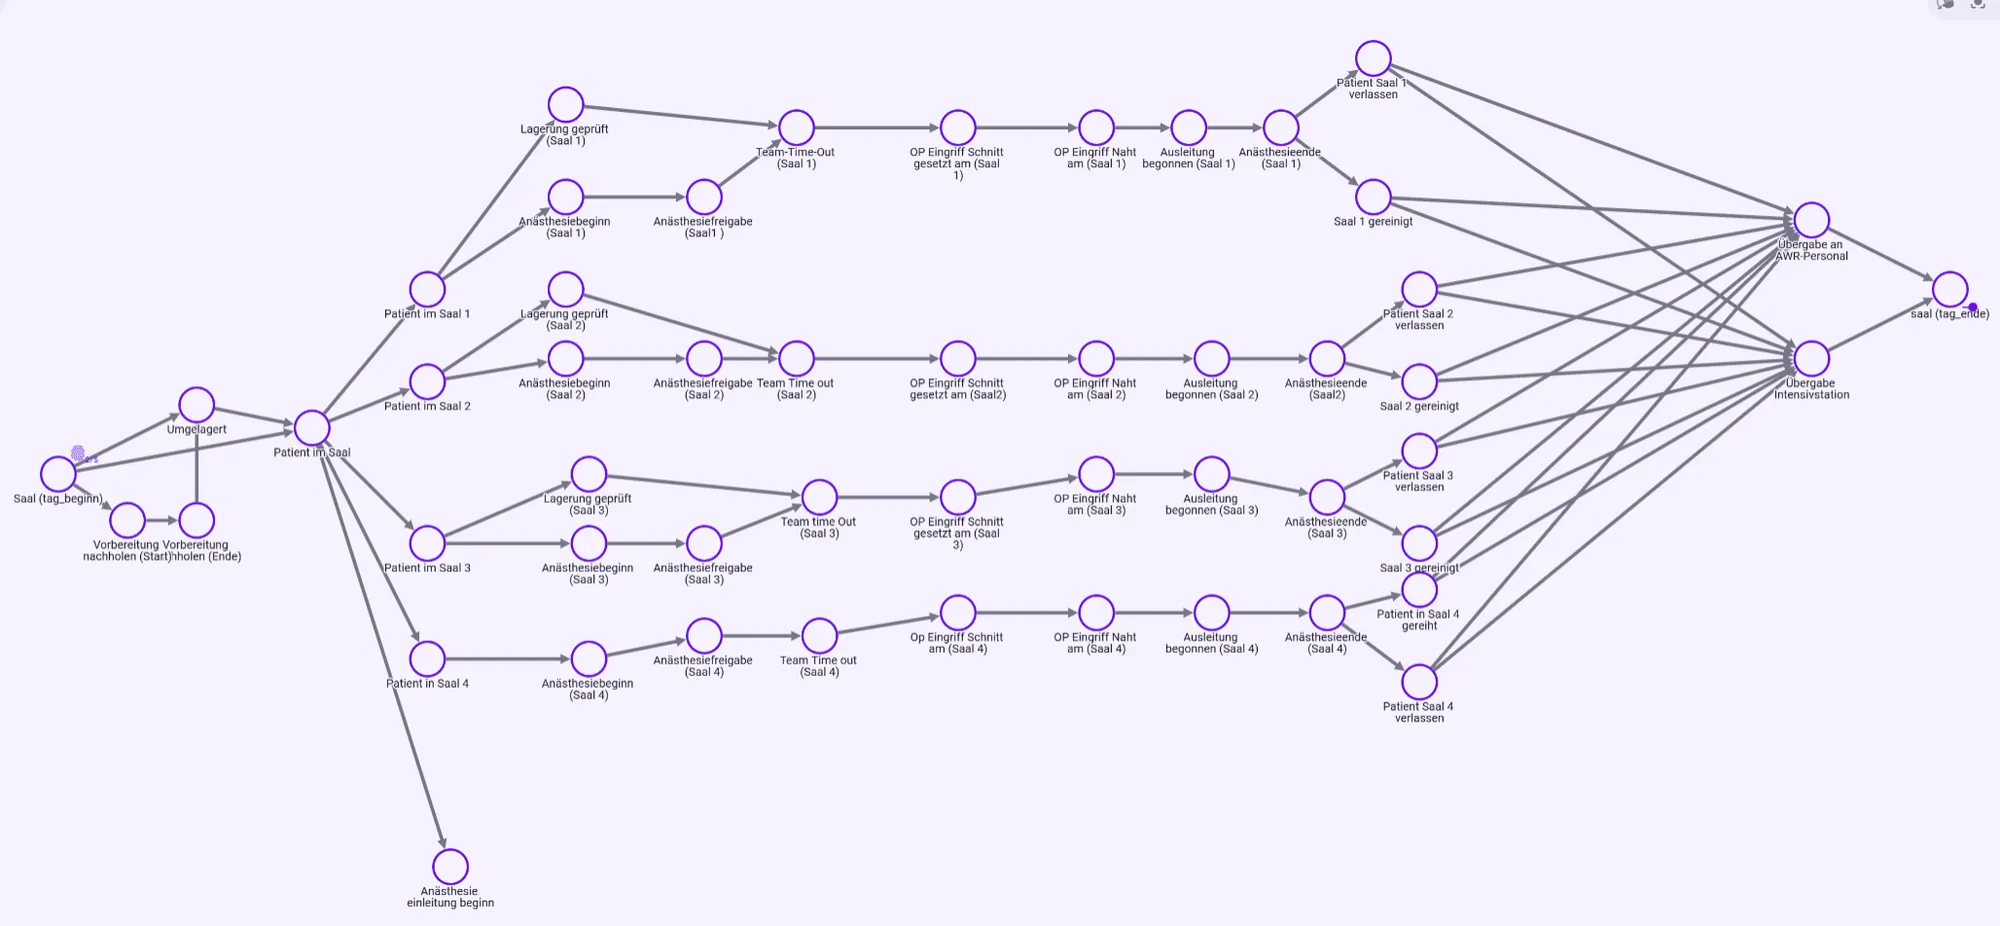
Causal perspective of the OR day: from the start of the day through transfer to the table and patient in OR into four parallel room strands with positioning checked, anaesthesia start, anaesthesia release, team time-out, incision, suture, emergence and anaesthesia end to patient leaves OR and OR cleaned, followed by handover to PACU staff or the intensive care unit and the end of the day
Induction, surgery and room occupancy: cross-case delay cascades build up over the OR day.

Phase 3

PACU, bed & transfer

After surgery the patient is cared for in the recovery room (PACU) and then transferred to a ward or the intensive care unit. If the patient is ready for transfer but no bed has been released yet, the PACU bay stays occupied. If the PACU is full, the next patient cannot leave the operating room.

Business objects

  • Patient
  • Surgical case
  • PACU
  • PACU bay
  • Transfer clearance
  • Ward bed
  • Ward
  • Intensive care unit
  • Patient transport
  1. Handover to PACU staff
  2. Monitoring started
  3. Pain therapy started
  4. Transfer clearance
  5. Bed released
  6. Collection from PACU
  7. Handover to ward

Guiding question

What actually keeps the patient in the PACU after transfer clearance – the missing bed, the transport or another bottleneck?

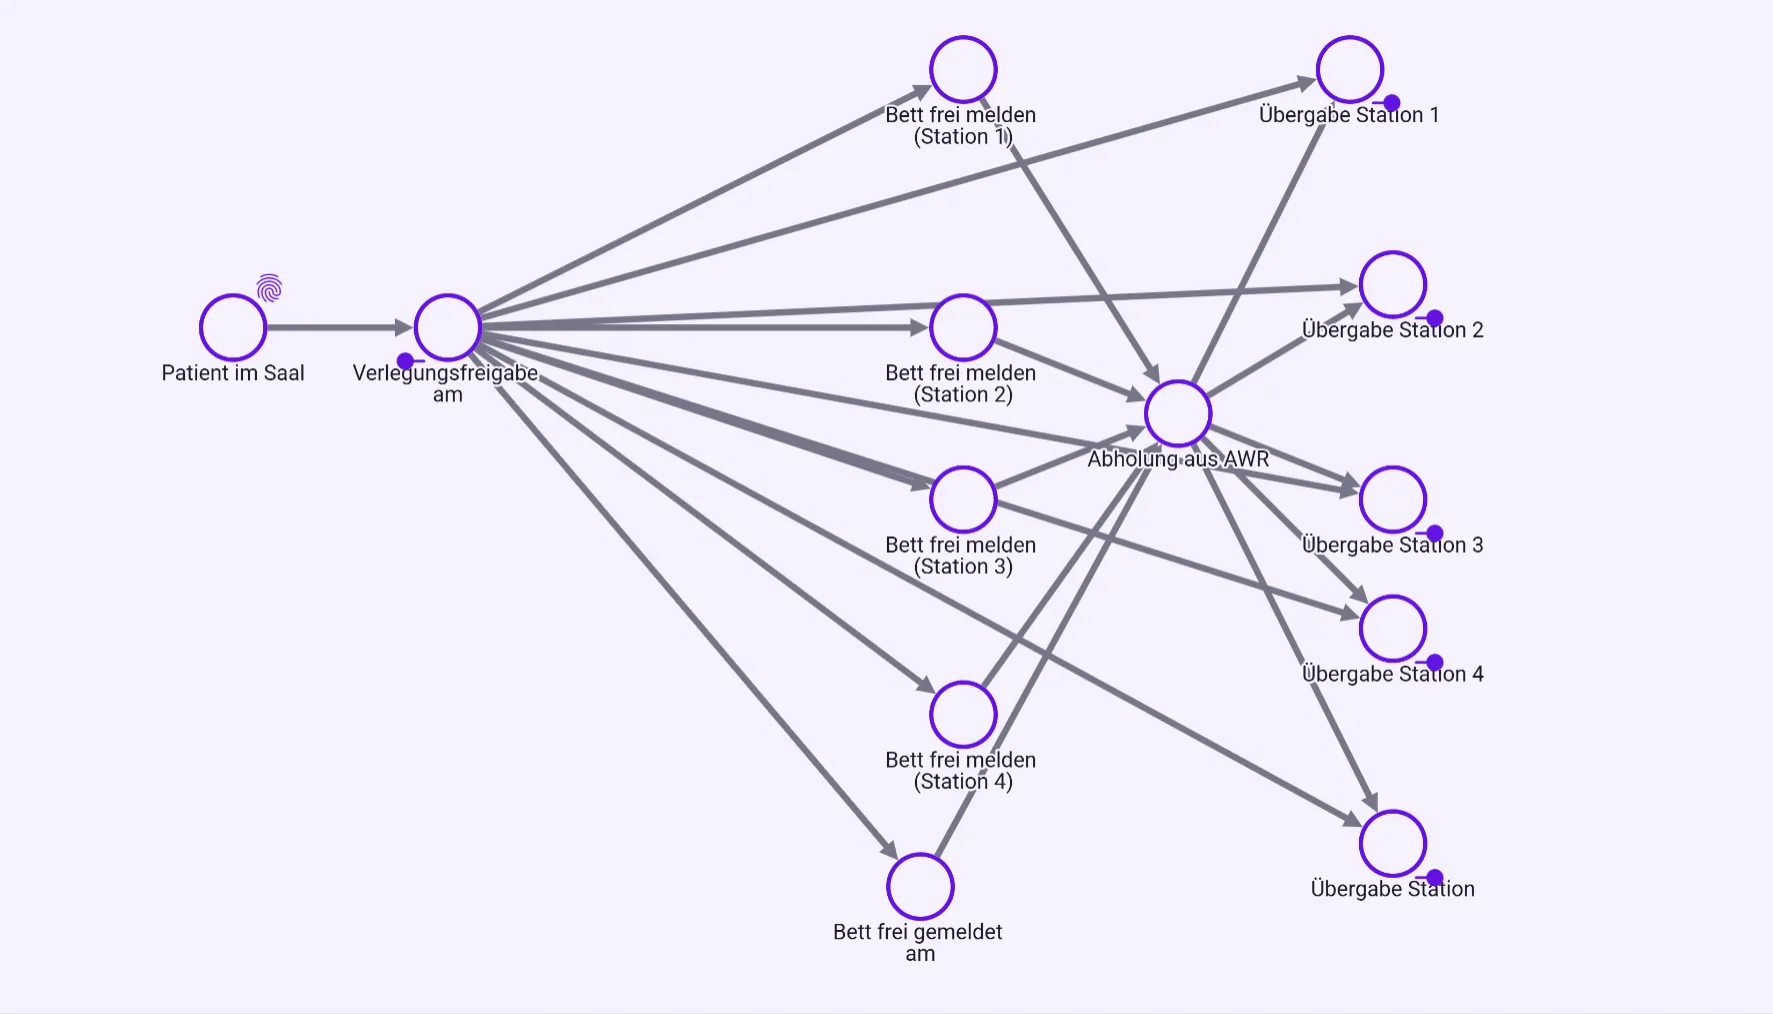
Causal perspective of the PACU and bed release: from patient in the operating room through transfer clearance to “release bed” for wards 1 to 4 or “bed released”, then on to collection from the PACU and handover to wards 1 to 4
Backlog between PACU, bed release, patient transport and operating room.

A patient can have several procedures, an operating room serves several patients in a row per OR day, and PACU bays and ward beds are occupied by changing patients. These shared resources connect cases across case boundaries – which is exactly where delays arise that a single-case view cannot explain.

Five findings along the surgical patient pathway

The findings lead from the management KPI through three refuted suspicions to the cross-case cascades. Each one shifts the question from “Where does the problem show?” to “Where does it arise?”.

Finding 1 · KPIs

The KPIs show the where – but not yet the why

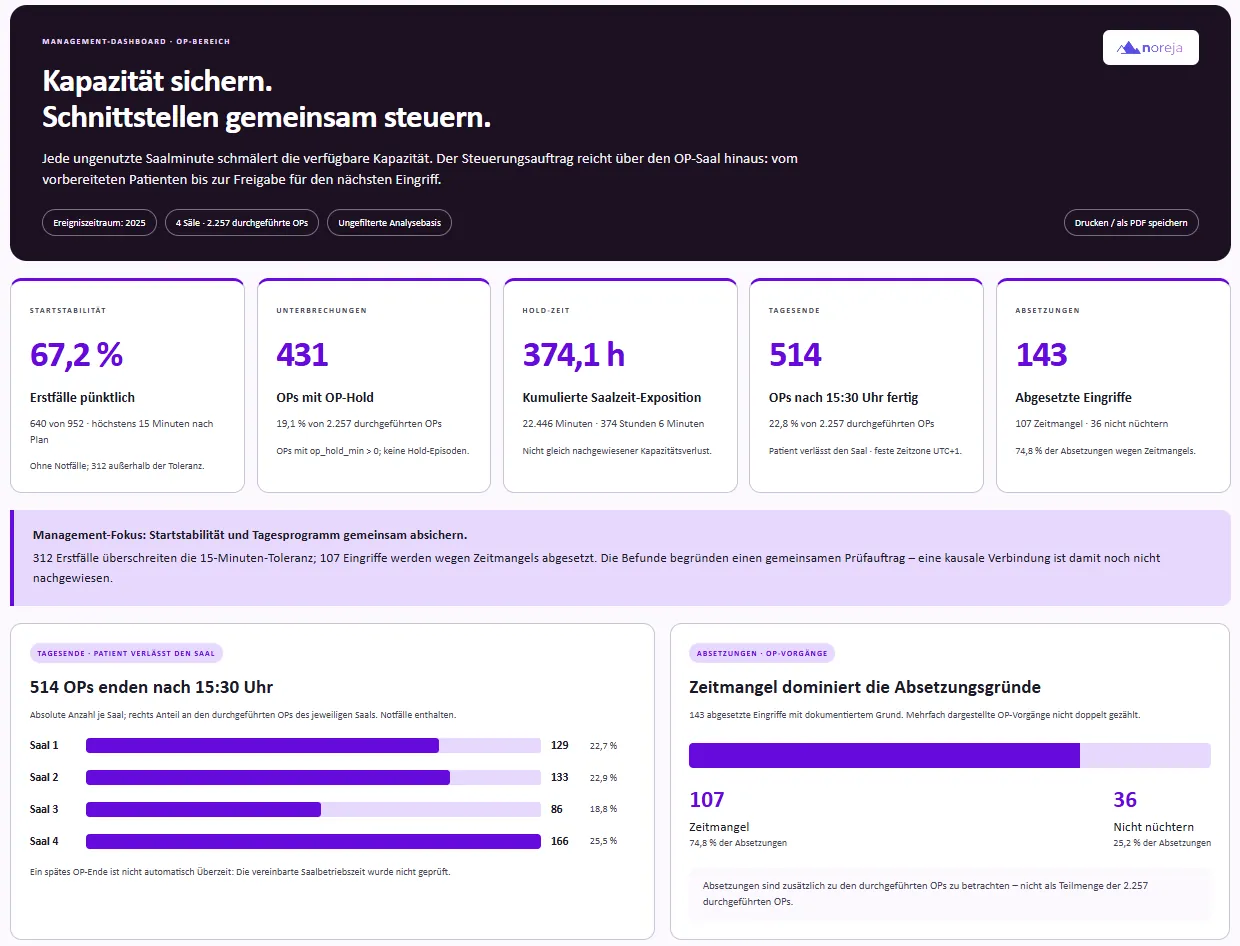
Only 67.2% of first surgeries start on time. 431 surgeries are affected by an OR hold, adding up to 374.1 hours of blocked OR capacity. 143 procedures are cancelled, 107 of them for lack of time.

The problem seems clear: the OR is losing time and capacity. But the KPIs do not say where this loss arises.

67.2%

of the first surgeries of an OR day start on time – within 15 minutes of the planned OR entry

Instead of “How do we make the OR faster?”

the analysis asks: “Where does the time loss that becomes visible in the OR arise?”

Management dashboard for the OR area, “Secure capacity. Manage interfaces together.”: 67.2% of first cases on time (640 of 952), 431 surgeries with an OR hold, 374.1 hours of cumulative hold time, 514 surgeries finished after 15:30 and 143 cancelled procedures, 107 of them for lack of time and 36 for missing fasting; below, the surgeries ending after 15:30 per operating room
Management dashboard: first cases on time, OR holds, blocked OR time, end of day and cancelled procedures.

Finding 2 · Cross-check

Three obvious suspects – none survives the cross-check

The first analyses show three conspicuous correlations. Each one suggests a quick measure: train team C, optimise OR 4, add staff to the PACU.

The data was correct. The obvious conclusions were not sufficiently justified.

Raw comparison and cross-check
SuspicionRaw comparisonCross-check
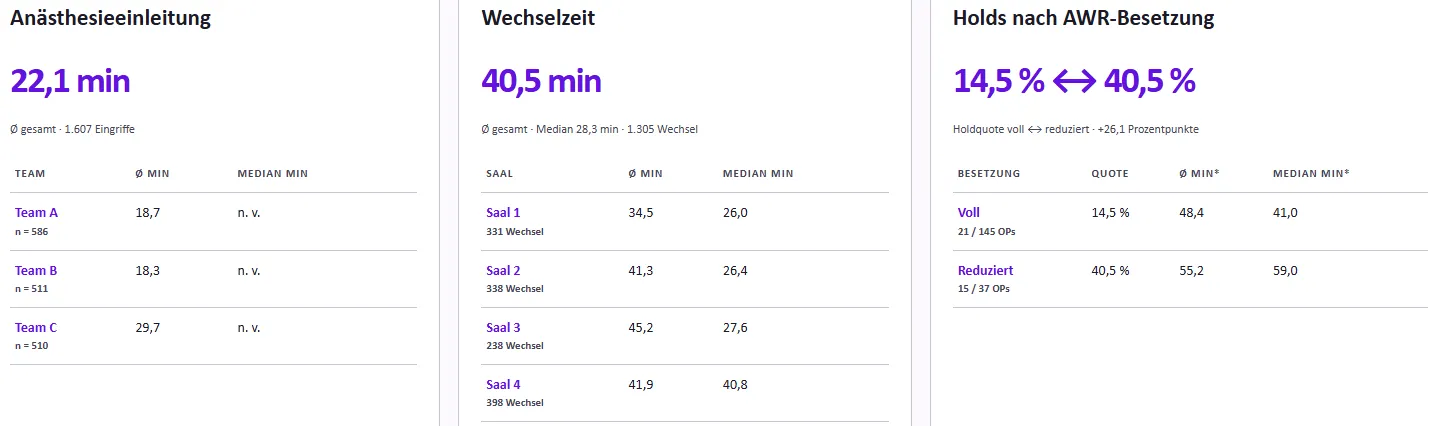
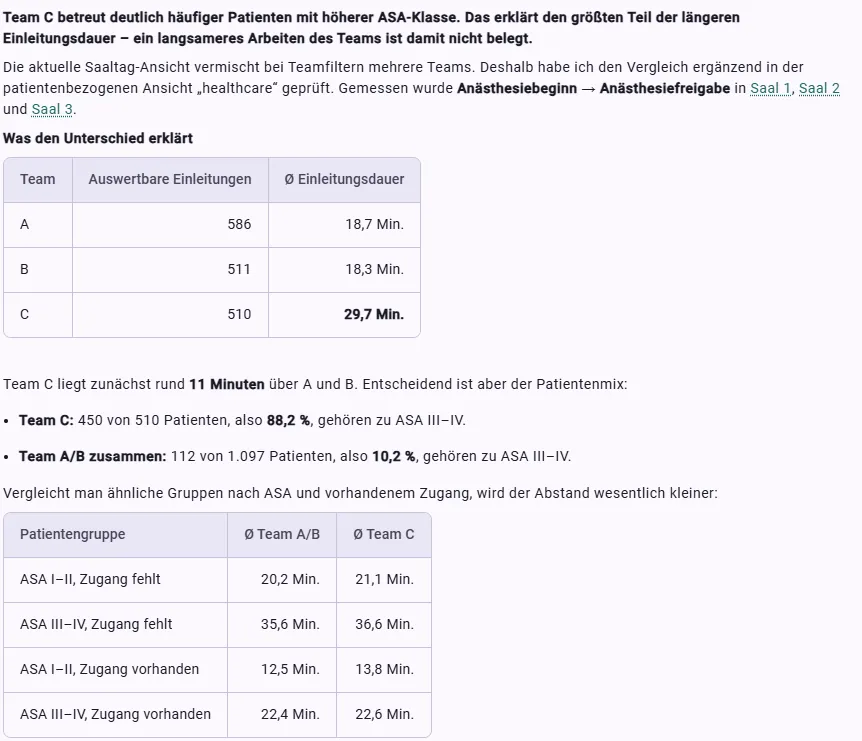
Anaesthesia team C is slowerInduction takes 29.7 min on average (team A 18.7, team B 18.3)Equally fast with comparable patients (ASA) – team C mainly cares for the severe cases
OR 4 works inefficientlyClearly higher median turnover timeOR 4 takes cases from several specialties; the specialty changes cost time, not the room
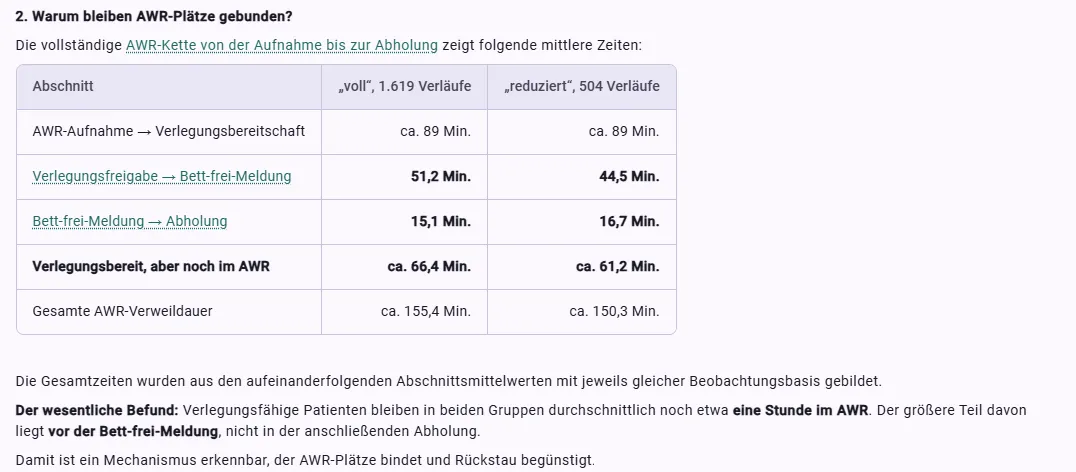
Too few staff in the PACUHold rate 40.5% with reduced, 14.5% with full staffingThe PACU is occupied because patients are waiting for a bed – the bottleneck lies further down the resource chain

0 of 3

obvious explanations – anaesthesia team C, OR 4 and PACU staffing – hold up when comparable cases are compared

Instead of “Train team C, optimise OR 4, add PACU staff”

the analysis asks: “Does the difference hold up when we compare comparable cases?”

Three dashboard tiles with raw comparisons: anaesthesia induction averaging 22.1 minutes over 1,607 procedures (team A 18.7, team B 18.3, team C 29.7 minutes), turnover time averaging 40.5 minutes with a median of 28.3 minutes over 1,305 turnovers (OR 4 with a median of 40.8 minutes versus 26.0 to 27.6 minutes in ORs 1 to 3), and a hold rate of 14.5% with full and 40.5% with reduced PACU staffing
Conspicuous correlations in the raw comparison: anaesthesia team, turnover time per room and hold rate by PACU staffing.
Minerva answer on induction time: 88.2% of team C’s patients belong to ASA classes III–IV (450 of 510), compared with 10.2% for teams A and B together (112 of 1,097); in comparable patient groups by ASA class and existing venous access the averages are close, for example 22.4 versus 22.6 minutes for ASA III–IV with access in place
Team C: the patient mix by ASA class explains most of the longer induction time.
Minerva table “Why do PACU bays stay tied up?” for 1,619 cases with full and 504 with reduced staffing: in both groups, patients ready for transfer stay in the PACU for about an hour on average (66.4 and 61.2 minutes), most of it between transfer clearance and bed release
PACU staffing: patients ready for transfer stay about an hour in the PACU with full and reduced staffing alike – mostly before the bed is released.

From symptom to root cause analysis

Business question to Minerva
“Analyse why surgeries were cancelled.”
Business question to Minerva
“Which preceding surgeries and resource conflicts contributed to the 107 procedures cancelled for lack of time?”

Of the 143 cancelled procedures, 107 were cancelled for lack of time. “Lack of time”, however, is not a root cause but the documented reason at the end of a development.

The 107 cases are spread across 95 OR days. To understand how the missing time arose, looking at the cancelled patient is not enough. The analysis includes the preceding surgeries of the same OR day and the shared resources. Three delay patterns recur:

  • Before surgery

    Preparation steps are completed late.

  • After surgery

    Patients stay in the operating room longer because of OR holds.

  • Between procedures

    Delays from preceding cases carry over to the following surgeries.

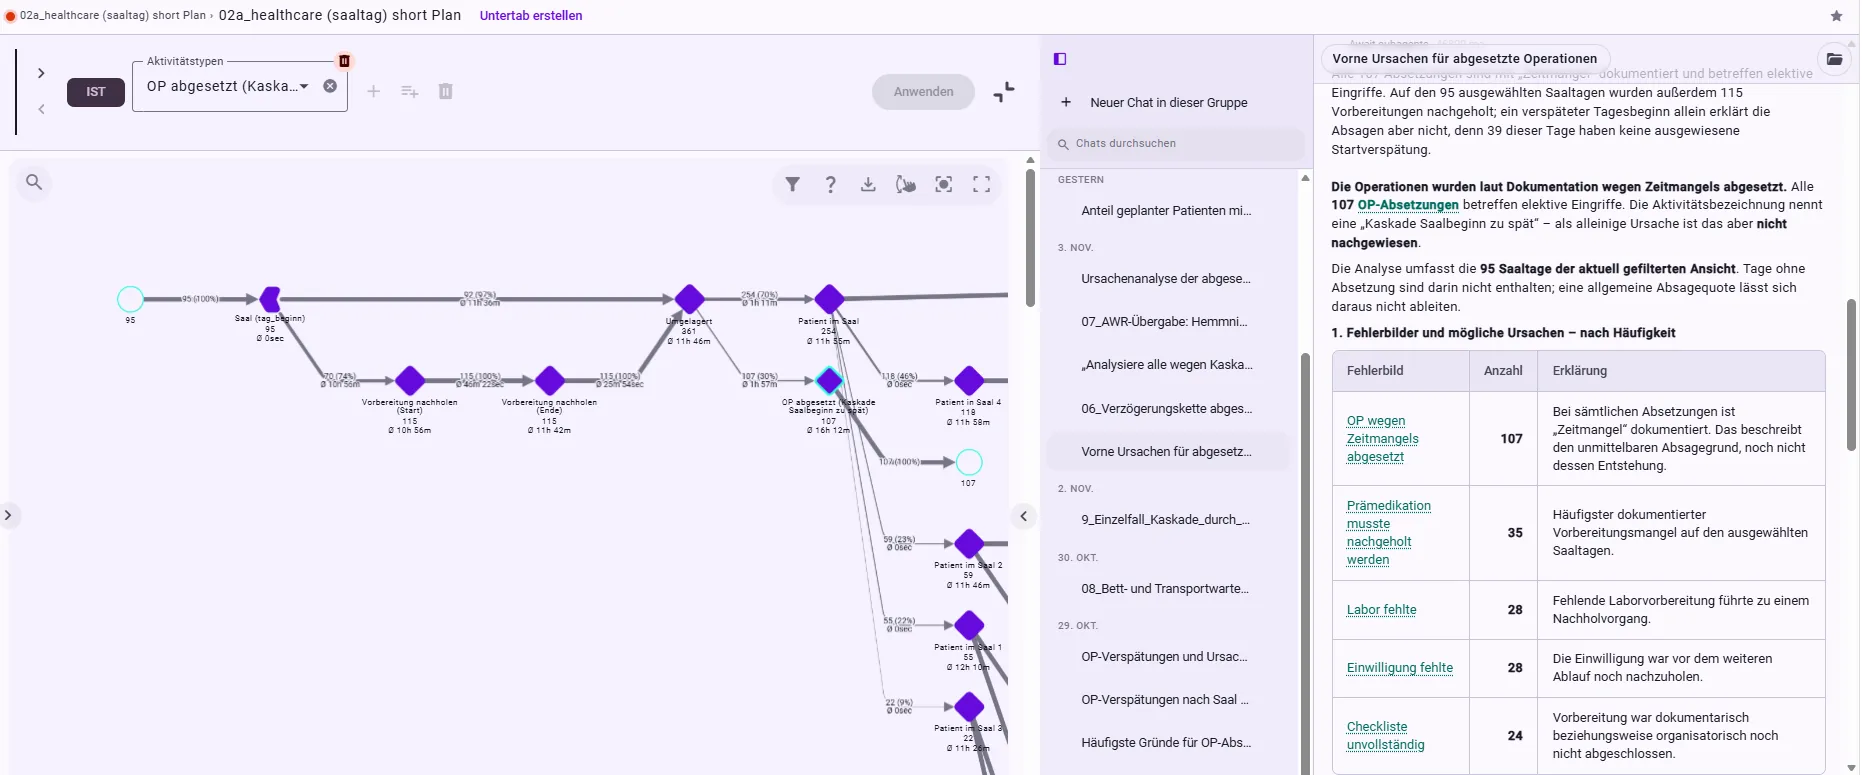
OR-day view filtered on the 107 procedures cancelled for lack of time on 95 OR days, next to the Minerva answer: all cancellations concern elective procedures, 115 preparations were completed late on these days, and 39 of the days show no start delay; the documented error patterns that follow are premedication completed late (35), missing lab tests (28), missing consent (28) and an incomplete checklist (24)
Minerva: causes of the 107 procedures cancelled for lack of time – a late start of the day alone does not explain them.
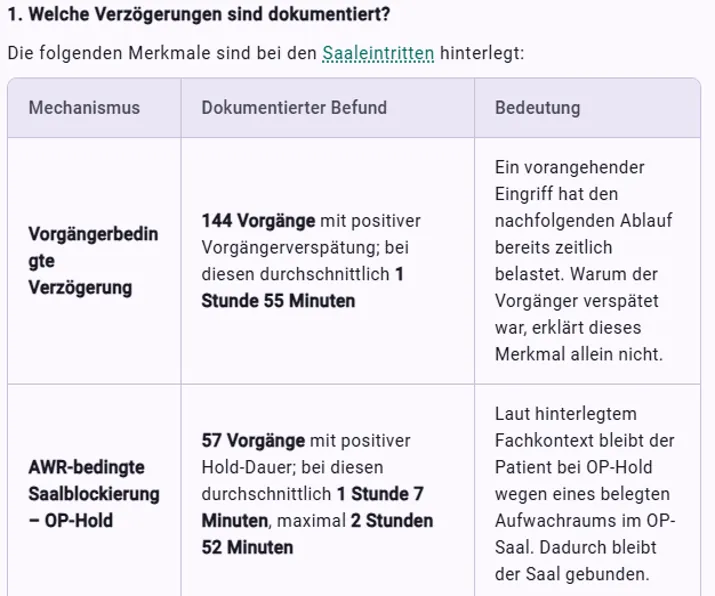
Minerva table on OR entries: 144 cases with a delay caused by the preceding case, averaging 1 hour 55 minutes, and 57 cases with the room blocked by a full PACU (OR hold), averaging 1 hour 7 minutes and at most 2 hours 52 minutes
Minerva: upstream and downstream delays – late preceding cases and PACU-related OR holds.

Finding 3 · Preparation

Late preparation derails the first case

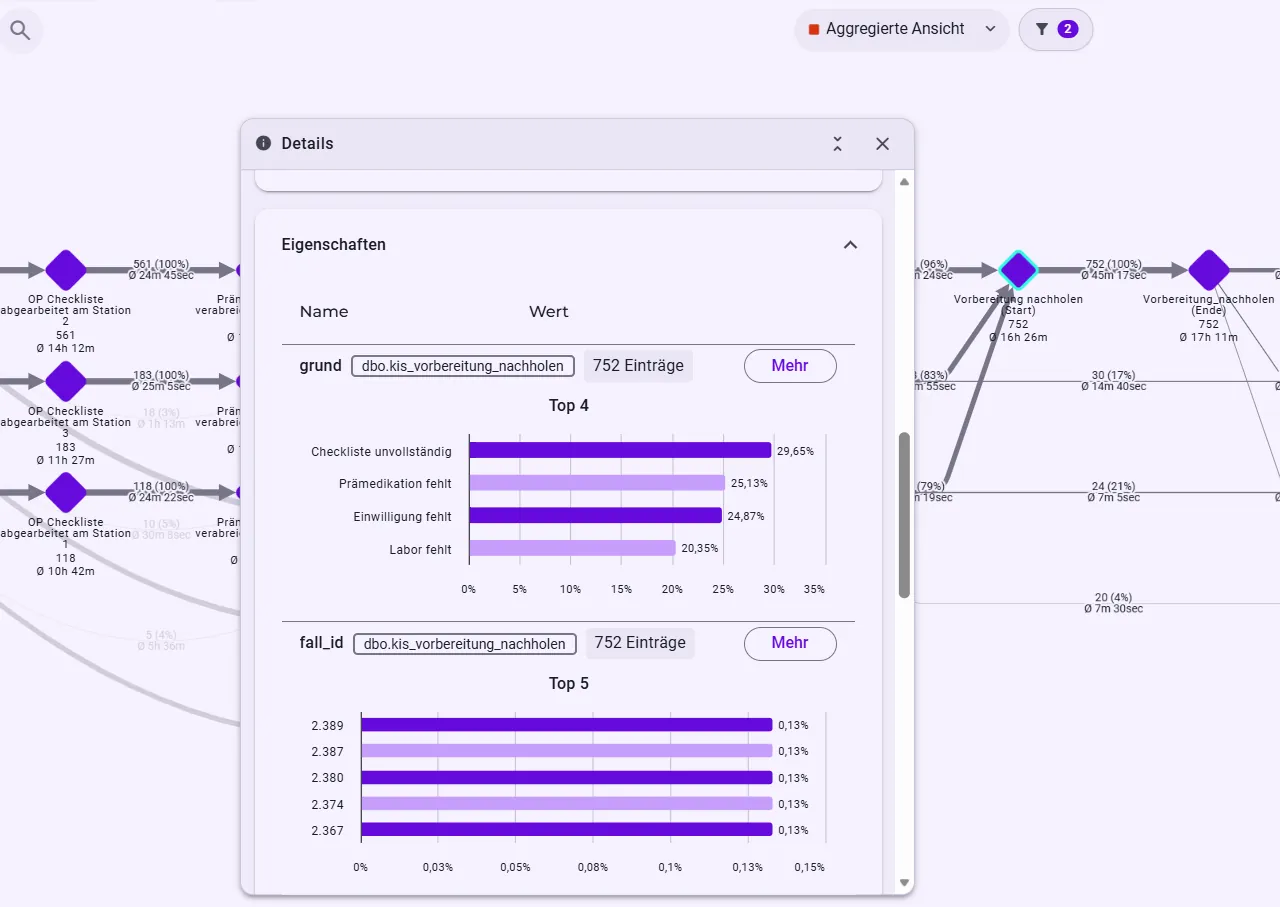
In 752 of 2,400 cases (31.3%), preoperative preparation is completed late, taking about 45 minutes on average. The documented reasons are an incomplete checklist, premedication, informed consent and lab tests.

The link is particularly clear for the first case of the day: with preparation completed late, only 26.3% start on time; without it, 91.8% do – 67.2% overall.

Business question to Minerva
“Which missing preparation steps drive late first OR entries? On which wards do they occur particularly often?”
Documented reasons for preparation completed late
ReasonCasesShare
Incomplete checklist22329.7%
Premedication18925.1%
Informed consent18724.9%
Lab tests15320.3%
Total752100%

26.3% vs. 91.8%

first OR entries on time with and without preparation completed late – 67.2% overall

Instead of “Why does the first surgery start late?”

the analysis asks: “Which preparation step is missing at call-up – and on which ward?”

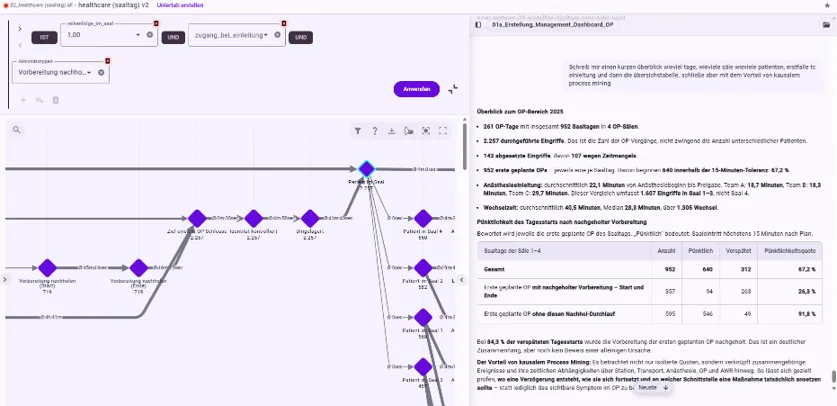
OR-day view filtered on preparation completed late, with a Minerva overview of the OR area in 2025: 261 OR days with 952 room days in 4 operating rooms and 2,257 procedures performed; first-case punctuality of 67.2% overall, 26.3% with and 91.8% without preparation completed late; for 84.3% of late day starts, the preparation of the first surgery was completed late
Effect of preparation on the punctuality of the first OR entry.
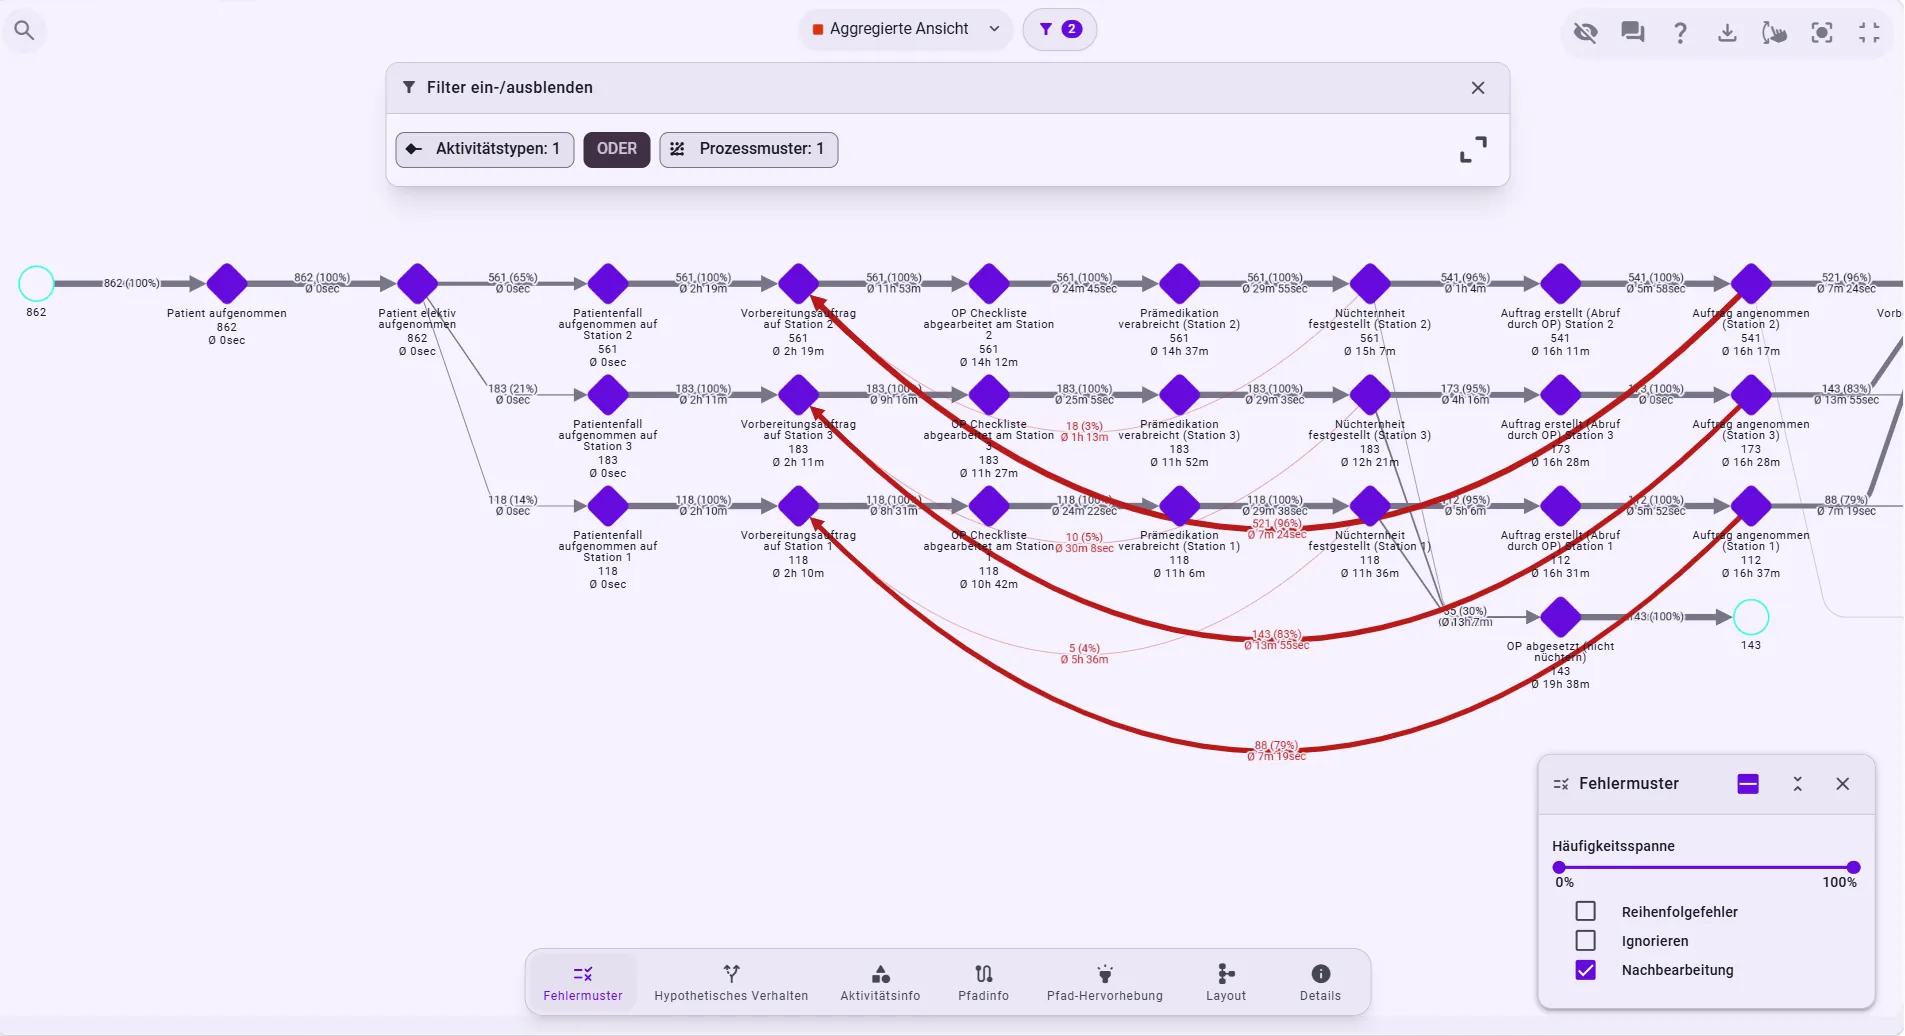
Causal perspective of preparation with the error pattern “rework” switched on: red loops from the accepted call-up order back to the preparation order – 521 cases on ward 2, 143 on ward 3 and 88 on ward 1
Error pattern “rework”: after call-up, the process jumps back into preparation.
Detail view of the activity “complete preparation later (start)” with 752 entries: incomplete checklist 29.65%, premedication missing 25.13%, consent missing 24.87%, lab tests missing 20.35%
Reasons from the activity properties: 752 preparations completed late.
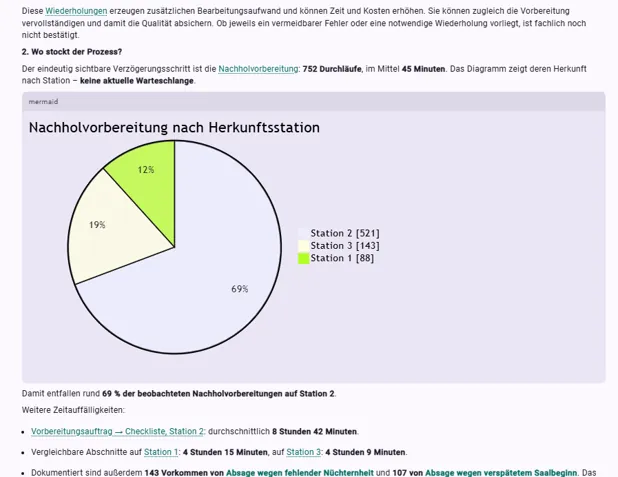
Minerva pie chart “Late preparation by ward of origin”: ward 2 with 521 cases (69%), ward 3 with 143 (19%) and ward 1 with 88 (12%)
Minerva: about 69% of the preparations completed late fall to ward 2.

Finding 4 · PACU & bed

The OR is blocked because the ward does not release a bed

Analysing the path transfer clearance → bed release → collection shows clear differences between the wards.

The subsequent transport takes a comparable 15–16 minutes on all three wards. So the bottleneck is not the collection but the bed release.

If a patient who is ready for transfer is not moved on, their PACU bay stays occupied. When the PACU fills up, the backlog reaches back into the OR.

From transfer clearance to bed release per ward
WardTransfer clearance to bed releaseFirst bed release usually at
Ward 119.3 min12:00
Ward 345.6 min13:00
Ward 266.9 min13:30

66.9 min

pass on average on ward 2 between transfer clearance and bed release – on ward 1 it is 19.3 minutes

Instead of “Do we need more staff in the PACU?”

the analysis asks: “Why is the PACU full at the time of the hold?”

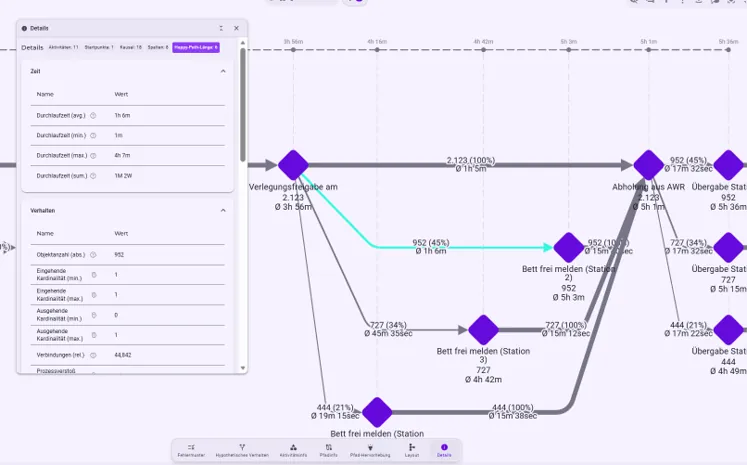
Causal perspective from transfer clearance (2,123 cases) through “release bed” per ward to collection from the PACU: ward 2 with 952 cases (45%) and 1 hour 6 minutes on average, ward 3 with 727 cases (34%) and 45 minutes, ward 1 with 444 cases (21%) and 19 minutes until the bed is released; then about 15 minutes each until collection
Waiting time between transfer clearance, bed release and collection by ward.
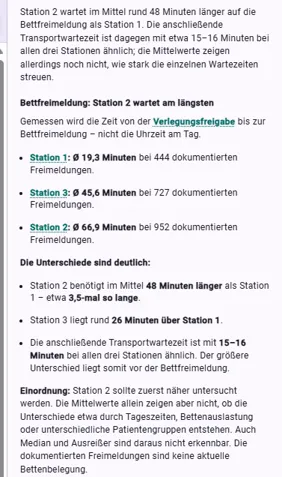
Minerva answer “Bed release: ward 2 waits longest”: on average 19.3 minutes on ward 1 (444 releases), 45.6 minutes on ward 3 (727) and 66.9 minutes on ward 2 (952); ward 2 needs about 48 minutes longer than ward 1, while the transport wait is 15 to 16 minutes on every ward
Minerva: ward 2 takes about 3.5 times as long as ward 1 to release a bed.
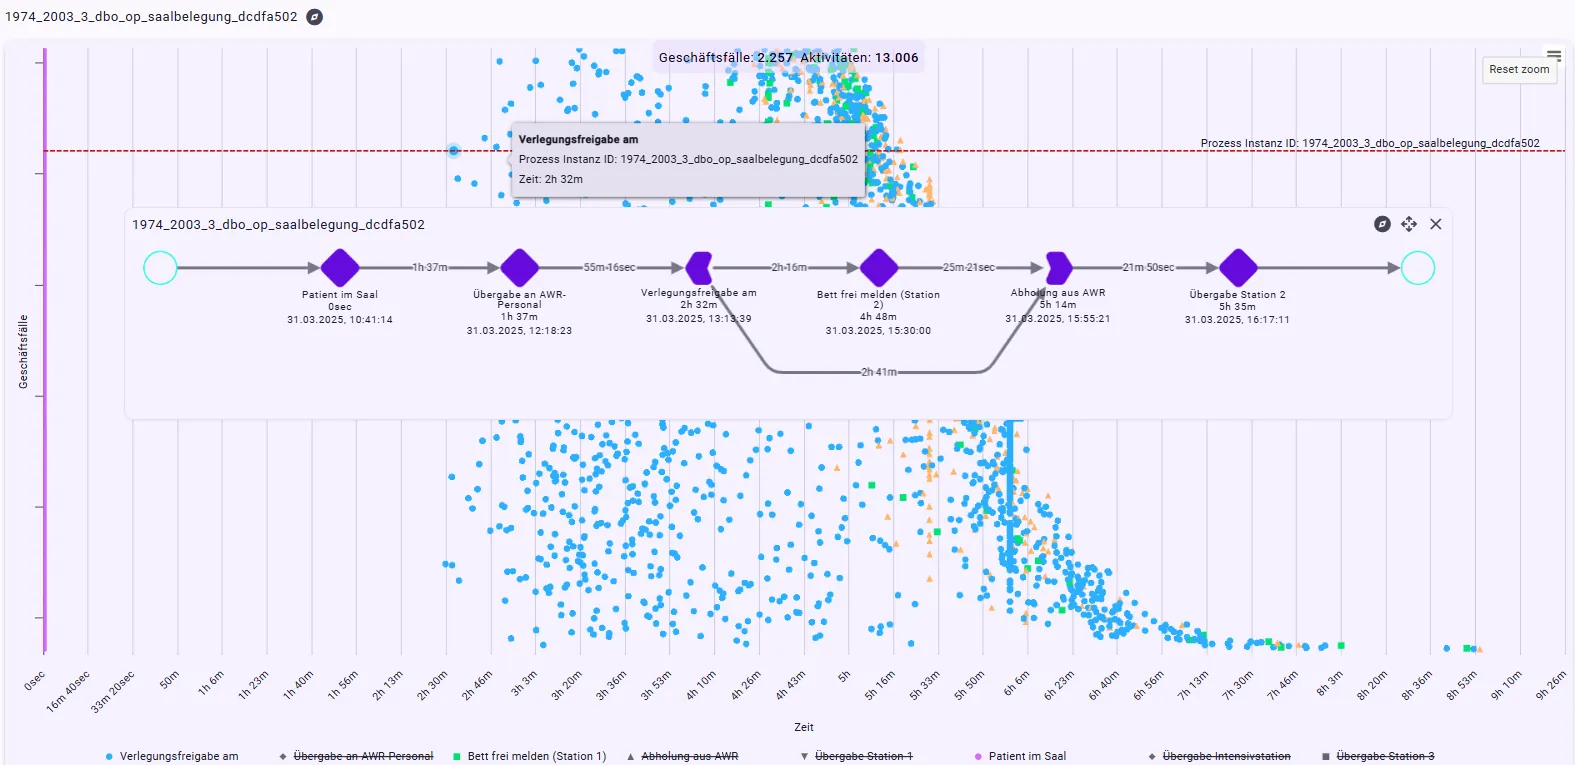
Distribution of events over the day with a single case overlaid: patient in OR, handover to PACU staff, transfer clearance, “release bed (ward 2)” 2 hours 16 minutes later, collection from the PACU and handover to ward 2
A single case over the day: more than two hours pass between transfer clearance and bed release.
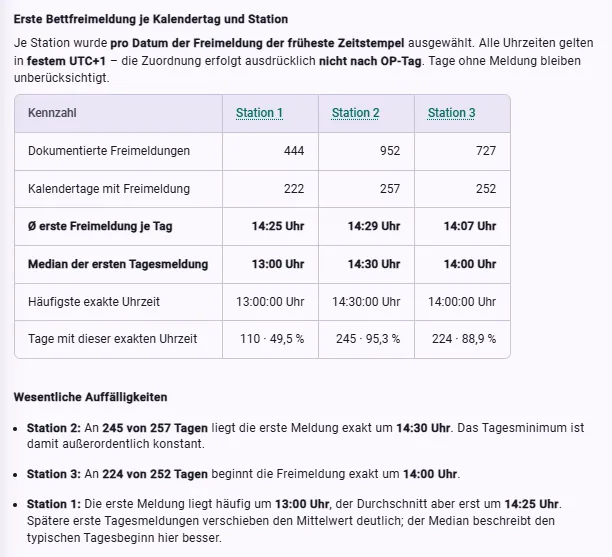
Minerva table “First bed release per calendar day and ward” with documented releases, calendar days, mean and median first release of the day and the most frequent exact time: on ward 2 the first release falls on the same time on 245 of 257 days (95.3%), on ward 3 on 224 of 252 days (88.9%)
Ward-specific patterns: the first bed release of the day almost always falls on the same fixed time.

Finding 5 · Cascades

The OR backlog arises between cases

The two main mechanisms run in opposite directions.

With the patient flow: when several procedures use the same operating room one after another, a late start carries over from case to case. In OR 4 on 25 November 2025, the checklist has to be completed late for the first procedure. That case starts 33 minutes late, the next one 74 and the third 110 minutes late. The fourth planned procedure is cancelled for lack of time.

Against the patient flow: after transfer clearance, patients wait for a ward bed, PACU bays stay occupied, and in the example a late collection adds to it. In the end, several operating rooms are affected at the same time – with holds of 59, 42 and 60 minutes.

OR 4 on 25 November 2025: four procedures, one cascade
ProcedurePlanned startOR entryDeviationCancelled
Surgery 423 · Appendectomy08:30:0009:03:17+33 minno
Surgery 2057 · Sigmoid resection10:55:2612:09:03+74 minno
Surgery 2119 · Hip replacement12:34:2814:24:56+110 minno
Surgery 215 · Sigmoid resection–––yes, 15:30

33 → 74 → 110 min

start delay of the first three procedures in OR 4 on 25 November 2025 – the fourth planned procedure is cancelled for lack of time

Instead of “Why was this procedure cancelled?”

the analysis asks: “Which earlier cases and resource conflicts used up the time?”

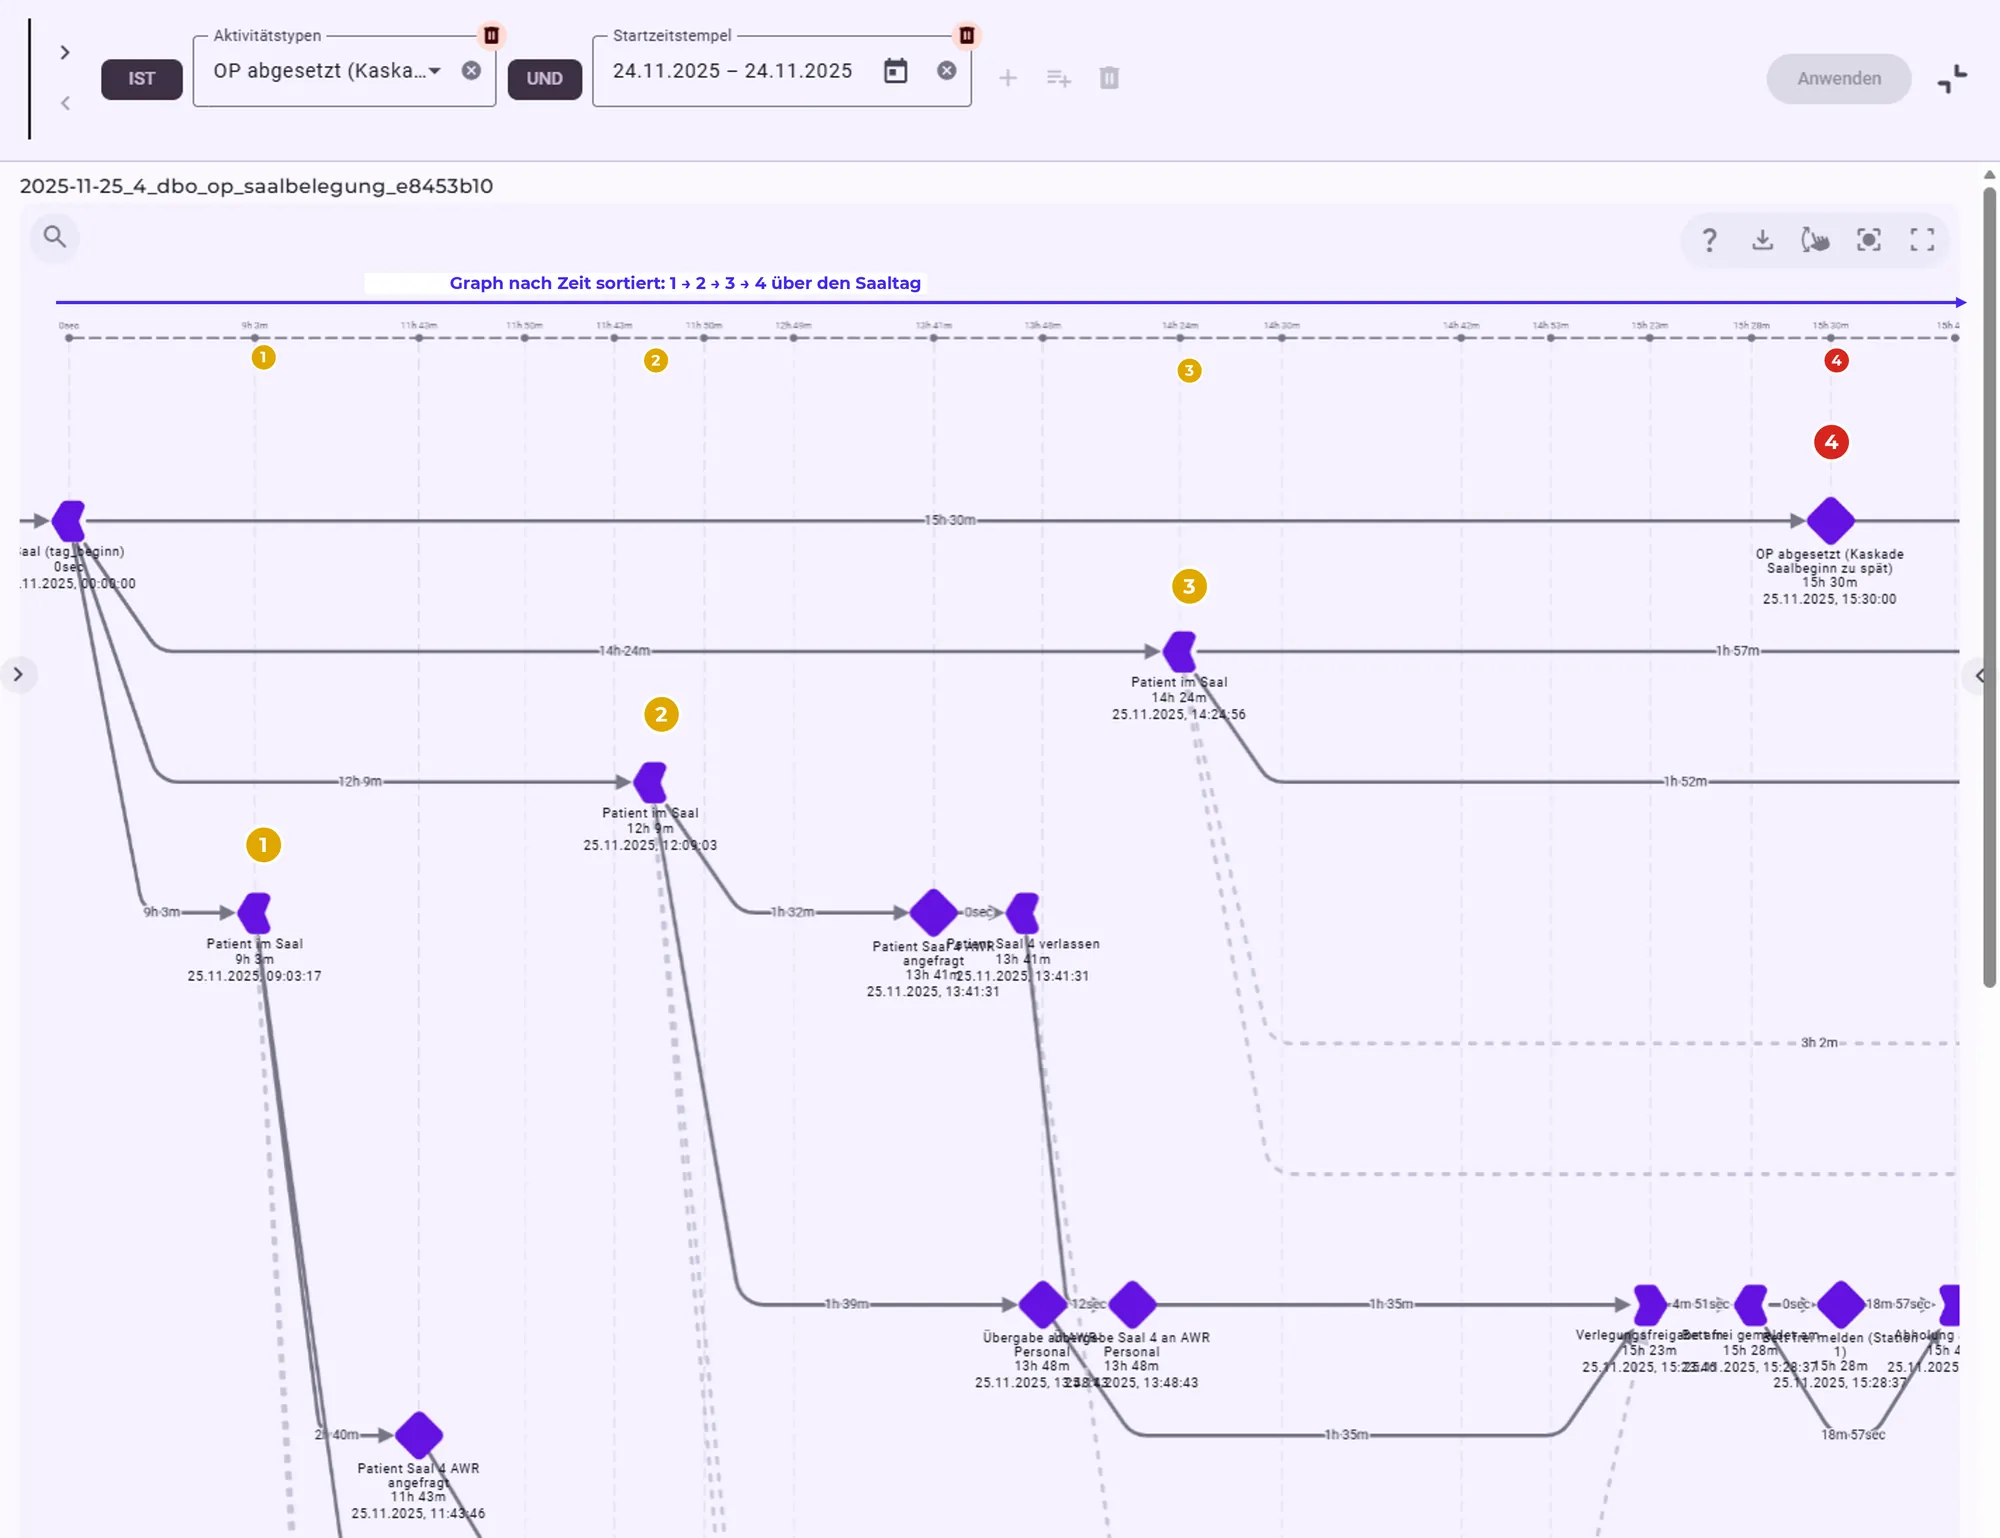
OR-day view of OR 4 on 25 November 2025, sorted by time: patient 1 in the room at 09:03, patient 2 at 12:09, patient 3 at 14:24; the fourth procedure is recorded at 15:30 as “surgery cancelled (cascade, late room start)”; below, the predecessors’ handovers to the PACU, transfer clearances, bed releases and collections
Four procedures, one cascade: OR 4 on 25 November 2025.
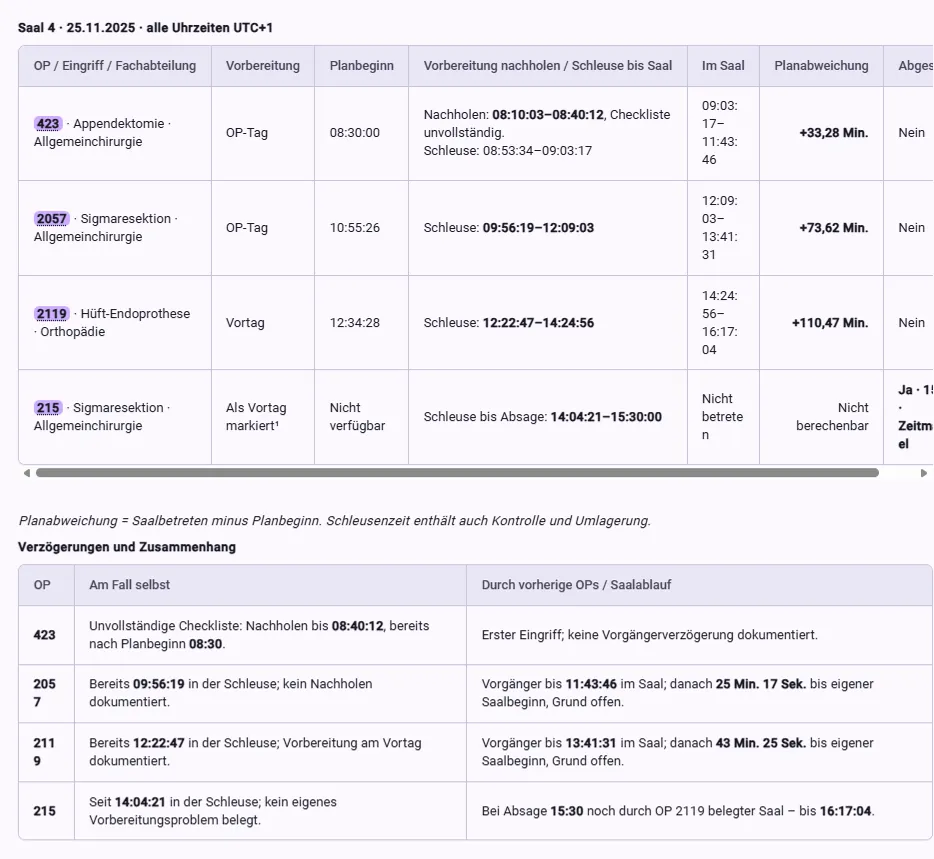
Minerva table for OR 4 on 25 November 2025: surgery 423 (appendectomy) with an incomplete checklist completed late starts 33 minutes behind plan, surgery 2057 (sigmoid resection) 74 minutes and surgery 2119 (hip replacement) 110 minutes behind plan; surgery 215 (sigmoid resection) is cancelled at 15:30 for lack of time while the room is still occupied by surgery 2119 until 16:17
Delays in the case itself and from previous surgeries: the cascade begins with the checklist completed late in the morning.
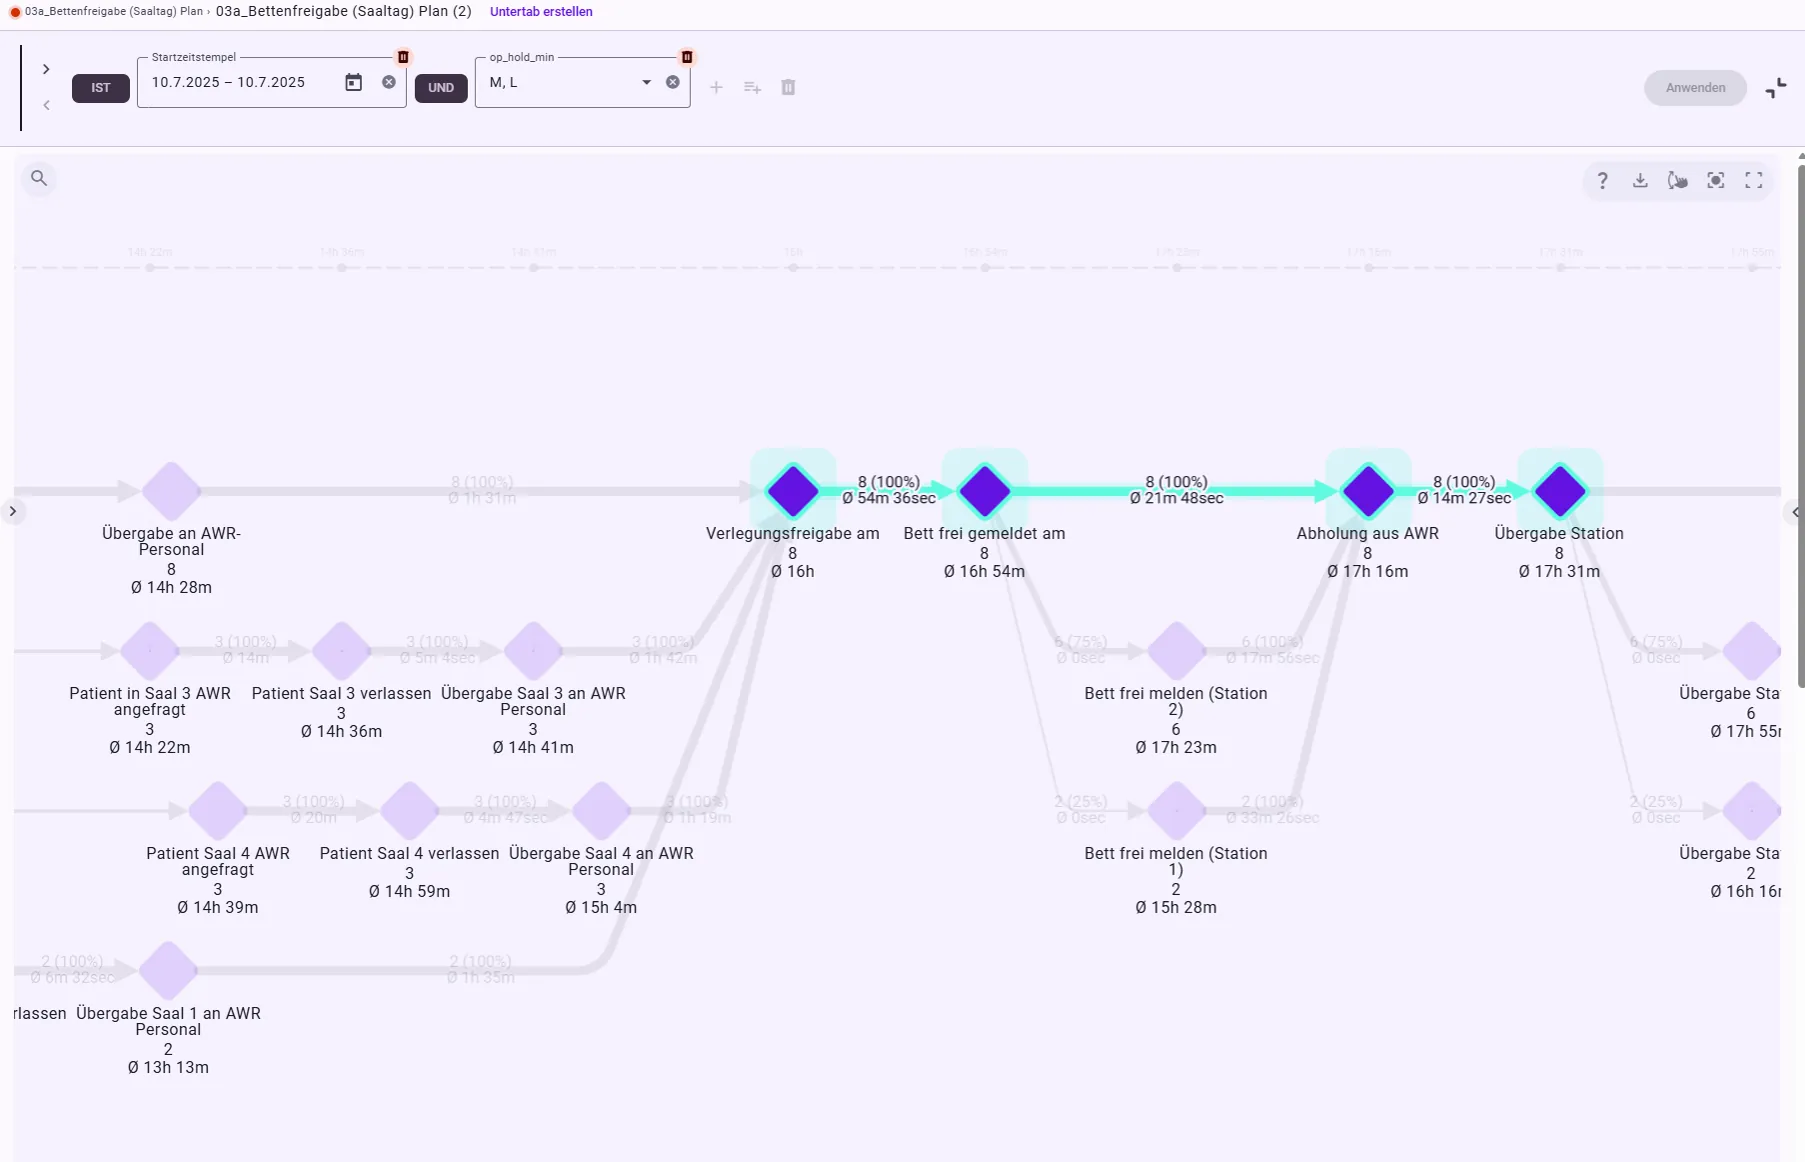
Bed release perspective on the example day of 10 July 2025, filtered on medium and long OR holds: eight cases from transfer clearance through “bed released” (55 minutes later on average) and collection from the PACU (another 22 minutes) to handover to the ward; before that, the handovers from ORs 1, 3 and 4 to PACU staff
Backlog chain: late bed release and collection – PACU bays stay occupied.
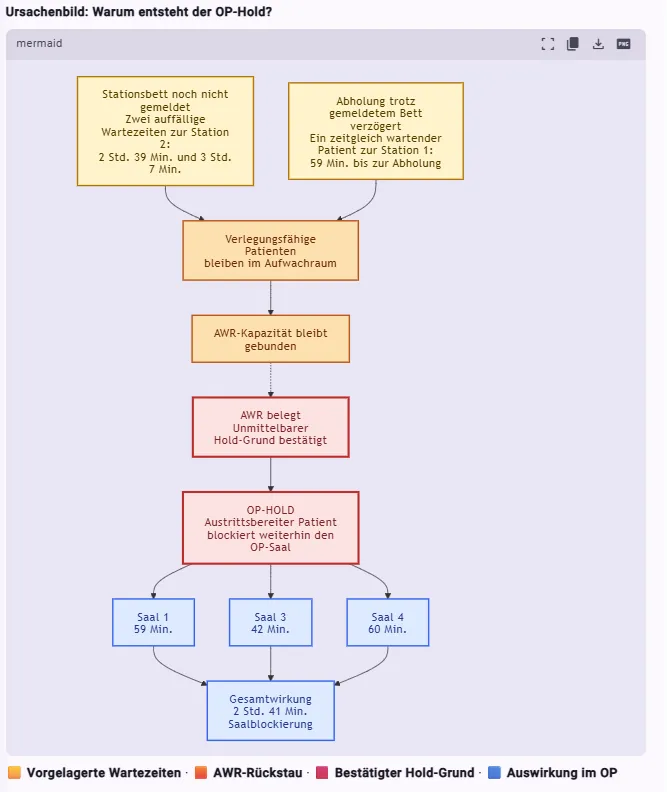
Minerva cause picture “Why does the OR hold arise?”: a ward bed not yet released (two conspicuous waits for ward 2 of 2 hours 39 minutes and 3 hours 7 minutes) and a delayed collection despite a released bed (59 minutes for ward 1) keep patients ready for transfer in the PACU; PACU capacity stays tied up, and OR holds block OR 1 for 59, OR 3 for 42 and OR 4 for 60 minutes – 2 hours 41 minutes in total
Cause picture: patients cannot leave the operating room – holds of 59, 42 and 60 minutes.

Four triggers, one consequence

Business question to Minerva
“Summarise the causes of the cancellations for lack of time.”

Four triggers lead to the same consequence: following procedures slip back and the remaining capacity of the day shrinks. When it is no longer sufficient, the next planned procedure is cancelled for lack of time.

  • Incomplete preparation

    Completed before transport or OR entry → later start.

  • Occupied PACU / missing bed

    The patient cannot be transferred → later exit from the OR.

  • Emergency add-on case

    The planned sequence and the available capacity change.

  • Batched bed releases

    Patients ready for transfer stay longer in the PACU.

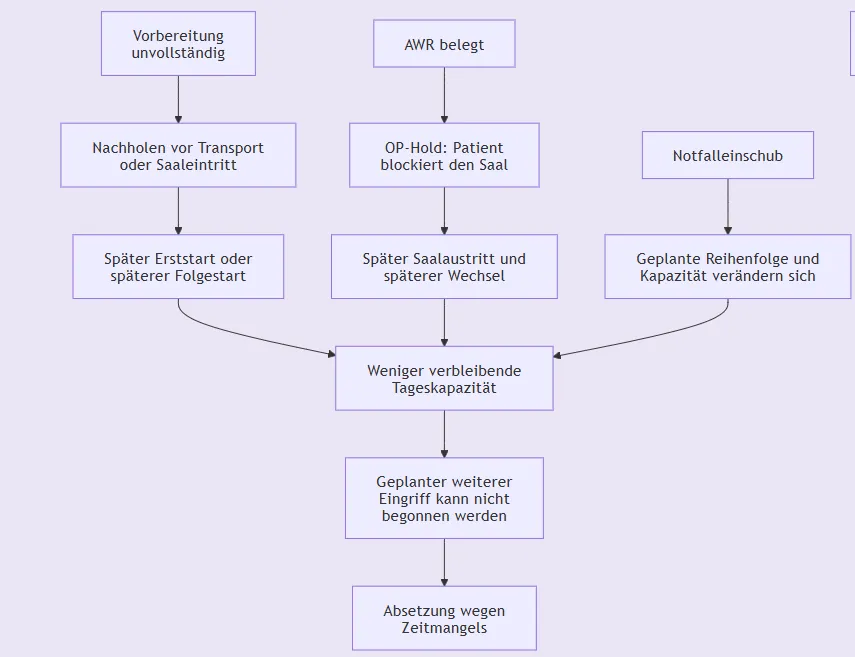
Minerva cause diagram: incomplete preparation leads, via completion before transport or OR entry, to a later first or follow-up start; an occupied PACU leads, via the OR hold, to a later exit from the room and later turnover; an emergency add-on changes sequence and capacity; all three reduce the remaining capacity of the day until a planned procedure can no longer start and is cancelled for lack of time
Minerva: triggers of a delay chain that ends in a cancellation for lack of time.
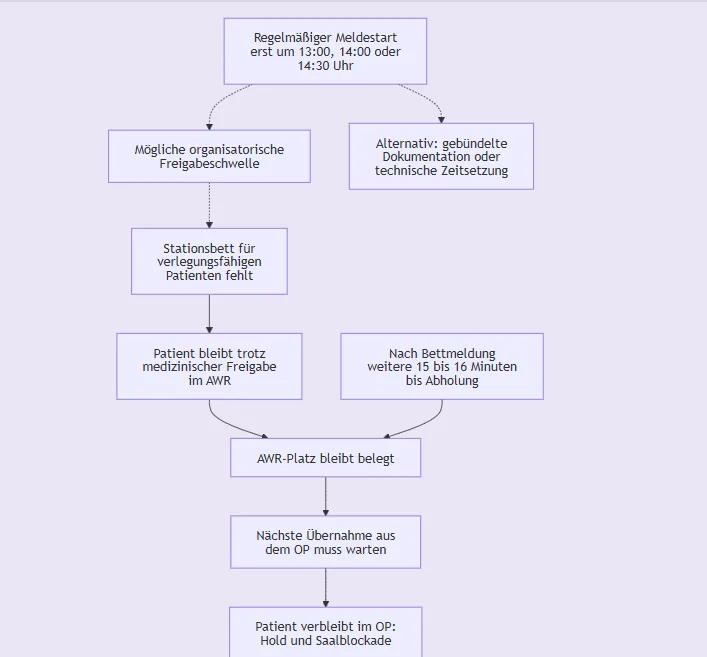
Minerva cause diagram on bed release: a regularly late start of bed releases – possibly an organisational release threshold, alternatively batched documentation or a technical time stamp – means ward beds are missing for patients ready for transfer; the patient stays in the PACU despite medical clearance, another 15 to 16 minutes pass after the bed release until collection, the PACU bay stays occupied, the next handover from the OR has to wait and the patient remains in the OR: hold and blocked room
Minerva: batched bed releases carry the backlog all the way to a blocked operating room.

Why AI needs causal process mining

Generative AI can summarise patterns and formulate measures quickly. In the OR example it would immediately have derived three measures from the raw comparisons: train team C, optimise OR 4, add staff to the PACU. None of them would have hit the cause.

Process data alone does not provide meaning

System data shows values and events: a timestamp for the bed release, a reason for late preparation, an ASA class. But it does not automatically explain what a feature means in business terms – for example that an ASA III/IV induction may take longer, that a change of specialty requires a different set-up, or that wards release their beds according to fixed routines.

Company context adds this meaning. Causal process mining then tests how features, process behaviour and outcomes are connected across cases and resources. Minerva combines these layers in a dialogue and makes the analysis accessible to the user.

Process data provides the facts. Company context provides the meaning. Causal process mining tests the cause hypotheses.

Changing a process on the basis of the right analysis

For AI-supported process decisions, four things are therefore decisive: the right business granularity, relationships between patients, resources and events, company context, and an analysis that does not rashly interpret correlations as causes.

Changing a process on the basis of the wrong analysis does not make it better – only wrong faster.

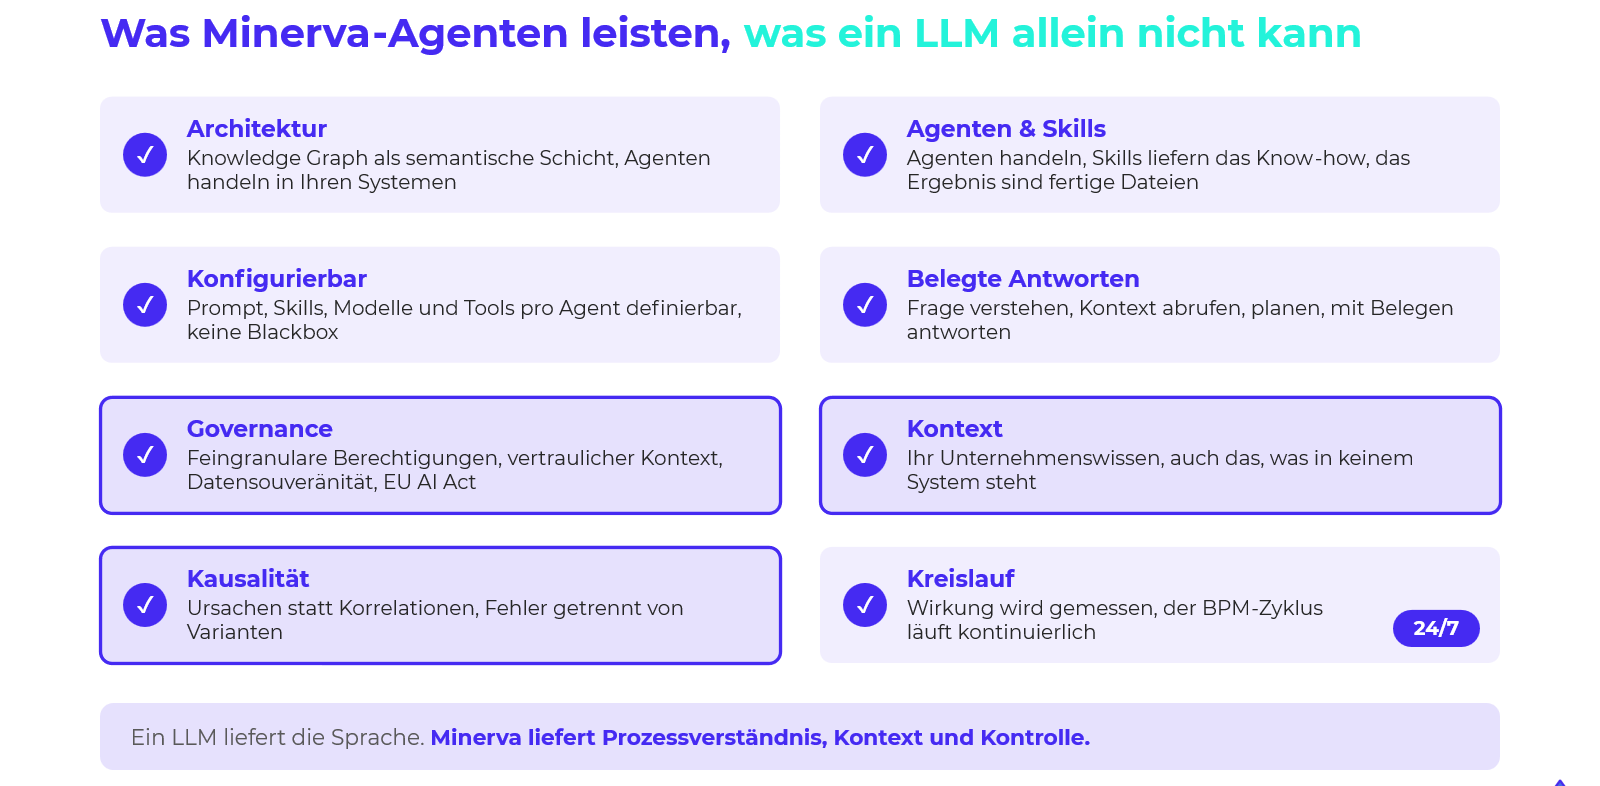
Overview “What Minerva agents do that an LLM alone cannot”: architecture, agents and skills, configurability, evidenced answers, governance, context, causality and a continuous 24/7 loop
What Minerva agents do that an LLM alone cannot.

Causal process mining creates the analytical basis. Minerva makes it usable in dialogue.

What causal process mining changes here

Classic process mining is very good at showing what happens: variants, cycle times, waiting times, repetitions and deviations. The why additionally requires business logic, context and cross-case relationships.

The healthcare case shows four things that a pure KPI or single-case analysis easily overlooks:

  1. 1

    Correlation is not automatically causation

    Team C, OR 4 and PACU staffing show how tempting raw comparisons are.

  2. 2

    The affected case does not necessarily carry its own cause

    The cancellation may have been set up by preceding cases or other patients.

  3. 3

    Shared resources connect cases

    Operating room, PACU bay and ward bed create dependencies across case boundaries.

  4. 4

    Not every finding needs a measure

    Some causes are prioritised, others investigated further or discarded.

From finding to prioritised measure

A finding does not change a process yet. After the analysis, the process owner decides which insights are actually worked on. In the Business Impact Board, findings are assessed by expected impact, implementation effort, risk and uncertainty; process excellence and the responsible department jointly prioritise which decision hypothesis is piloted.

Possible improvement directions
FindingPossible improvement directionImpact to assess
Bed release and PACU backlogReview the bed release process together with the wardsOR holds, blocked OR capacity, cancellations
Preoperative preparationComplete preparation fully before the patient is called upFirst-case punctuality, knock-on delays
Incomplete preparation (31.3%)Check checklist, premedication, informed consent and lab tests before call-upLate-preparation rate, nursing workload, punctuality
Specialty changes in OR 4Bundle scheduling by specialty and plan unavoidable changes realisticallyTurnover time, end of the OR day, cancellations
Team C and PACU staffingNo measure – spurious correlation; keep monitoring the patient mix and the bed bottleneckUncertainty
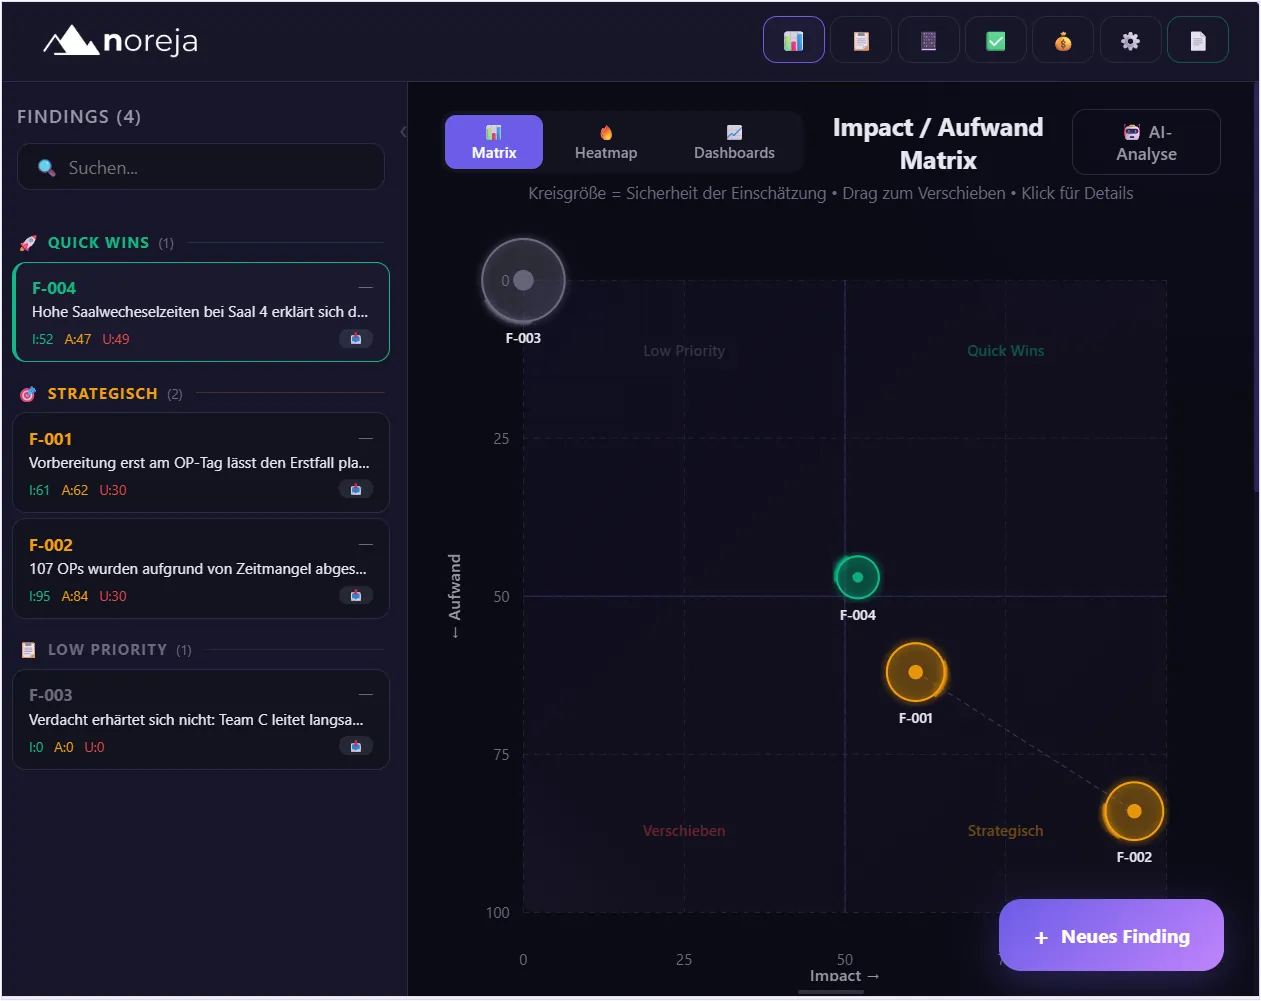
Business Impact Board with four findings from the OR case in the impact/effort matrix: F-001 on preparation only on the day of surgery and F-002 on the 107 surgeries cancelled for lack of time as strategic, F-004 on the high turnover times in OR 4 as a quick win, and F-003 “Suspicion not confirmed: team C induces more slowly” as low priority
Business Impact Board: from finding to prioritised option for action.

Prioritisation is a business decision. Minerva prepares analysis paths, context and options for action; control and decision-making authority remain traceable with the process owner and the responsible department at all times.

The loop: Insight → Action → Impact → Feedback

After prioritisation, a measure is piloted and its effect is measured again using the same process data. Minerva Frontier Agents can accompany this control loop continuously: detecting new findings, developing hypotheses further and observing the effect of measures implemented.

  1. 1

    Insight

    Preparation and PACU/bed mechanisms contribute to visible capacity losses in the OR.

  2. 2

    Action

    Stabilise preparation before call-up; address the cause of late bed releases organisationally.

  3. 3

    Impact

    Measure first-case punctuality, holds, blocked OR capacity, cancellations and the end of the OR day again.

  4. 4

    Feedback

    If implementation does not show the expected effect, the cause hypothesis is reviewed and adjusted.

Check after every measure

  • Do more first surgeries start within 15 minutes of plan?
  • Does the share of preparation completed late fall – and on which wards?
  • Do OR holds and blocked OR capacity decrease?
  • Are fewer procedures cancelled for lack of time?
  • Do fewer surgeries end after the planned end of the OR day at 15:30?
  • Does the bottleneck merely shift elsewhere between ward, OR, PACU and bed?

Four principles for the analysis

Preserve granularity

Patient, operating room, PACU bay and bed stay connected instead of reducing the process to a linear case up front.

Start with the business question

The causal perspective is built for the concrete business question – end-to-end, preparation, surgery, PACU and bed, or the OR day.

Cross-check correlations

A conspicuous raw comparison is a starting point, not yet a root cause.

Look beyond the single case

Shared resources connect cases; the cause may lie with a different patient.

Conclusion: optimising only the OR treats the symptom

Conspicuous KPIs alone are not sufficient steering logic. Team C looks slower, OR 4 stands out for its turnover times, and reduced PACU staffing correlates with more holds. Anyone who derives measures from this straight away may only be optimising the most visible symptom.

Causal process mining connects process data, business relationships, shared resources and cross-case dependencies. The OR example shows: preparation completed late destabilises the start of the day. Ward beds released late or in batches tie up PACU bays and carry the backlog into the OR. Delays carry over from procedure to procedure through preceding cases.

“Optimise the OR” thus becomes a more concrete task: stabilise preparation, look at bed and PACU processes together, understand cross-case cascades – and then measure whether the measures actually create more stability and capacity.

Don’t just see where the delay occurs. Understand where it arises. Prioritise causes. Measure the effect.

Frequently asked questions about Admission-to-Discharge

What is admission-to-discharge?

Admission-to-discharge is a patient’s end-to-end process in hospital, from admission to discharge. Noreja shows it on the surgical patient pathway: preoperative preparation on the ward, patient call-up and transport, anaesthesia induction and surgery, emergence and leaving the operating room, care in the recovery room (PACU) and the transfer to a ward or the intensive care unit. Patients, operating rooms, PACU bays and ward beds are connected through shared resources.

What is the perioperative patient pathway?

The perioperative patient pathway – also called the surgical patient pathway – is the end-to-end process around a surgical procedure: preoperative preparation and clearance, patient call-up and transport, induction and surgery, emergence and leaving the operating room, care in the recovery room (PACU) and the transfer to a ward or the intensive care unit.

What is an OR hold?

In an OR hold, a patient cannot leave the operating room after surgery because the recovery room (PACU) is full. The room stays tied up and the next procedure starts later. In the synthetic demo dataset, 431 surgeries are affected by an OR hold, adding up to 374.1 hours of blocked OR capacity – a figure that is not automatically avoidable one to one.

Why are surgeries cancelled for lack of time?

“Lack of time” is the documented reason, not the cause. In the OR case, 107 of 143 cancelled procedures are cancelled for lack of time, spread across 95 OR days. Three delay patterns recur: preparation completed late before surgery, OR holds after surgery, and delays from preceding cases that carry over to the following procedures. The cause may have arisen hours earlier and with a different patient.

Why does the first surgery of the day start late?

In the demo dataset mainly because preparation has to be completed late. With preparation completed late, only 26.3% of first procedures start on time; without it, 91.8% do. Overall, preparation is completed late in 752 of 2,400 cases (31.3%), taking about 45 minutes on average; the documented reasons are an incomplete checklist, premedication, informed consent and lab tests.

Does the PACU need more staff if more OR holds occur with reduced staffing?

Not necessarily. The hold rate is 40.5% with reduced and 14.5% with full staffing. The cross-check shows, however, that the PACU is occupied because patients ready for transfer are waiting for a ward bed – for about an hour on average in both staffing groups. The bottleneck lies further down the resource chain, at the bed release.

How are bed management and OR capacity connected?

Through the recovery room. If a ward does not release a bed, a patient ready for transfer stays in the PACU; if the PACU is full, the next patient cannot leave the operating room. In the demo dataset, it takes 19.3 minutes on average from transfer clearance to bed release on ward 1, 45.6 on ward 3 and 66.9 on ward 2, while the transport takes 15–16 minutes everywhere.

What is a delay cascade in the OR?

A cascade arises when a late start carries over from procedure to procedure because several procedures use the same operating room one after another. In the example of OR 4 on 25 November 2025, the checklist is completed late for the first procedure; the cases start 33, 74 and 110 minutes late, and the fourth planned procedure is cancelled for lack of time. The cancellation happens at the end of the day, the cascade begins in the morning.

Is an anaesthesia team with longer induction times slower?

Not in the demo dataset. Team C needs 29.7 minutes on average for induction, team A 18.7 and team B 18.3. But team C mainly cares for the severe cases: 88.2% of its patients belong to ASA classes III–IV. With comparable patients by ASA class, team C is just as fast – a spurious correlation, not a cause.

What data does the analysis of the surgical patient pathway need?

In the demo setup, 26 tables from 5 systems are combined in one event knowledge graph – for example the patient case, checklist, room occupancy, anaesthesia induction and emergence, patient transport, PACU stay and bed release. Patient, surgical case, operating room, PACU bay, bed and ward stay connected; a causal perspective is only derived for the concrete business question.

What role does the AI assistant Minerva play?

Minerva answers business questions in dialogue – such as “Analyse why surgeries were cancelled.” –, builds comparison groups, includes preceding surgeries and shared resources, and separates evidenced findings from cause hypotheses. The decision on measures stays with the process owner and the responsible department.

Are the figures from a real hospital?

No. All figures come from a synthetic perioperative dataset of 2,400 surgical cases. They illustrate the analysis method and are not production figures of any hospital.

The full case description

Event knowledge graph, the causal perspectives for preparation, surgery and PACU, all five findings with their analysis steps, the root cause analysis of the cancellations with Minerva and the way into the Business Impact Board – step by step in the Noreja Help Center (in German).

Read the case in the Help Center

Want to analyse your own process? Talk to us.

Ready to Start

Understand your end-to-end process causally — talk to us

Join companies that are redefining growth and efficiency with intelligent process analysis.