End-to-end process · Procurement in special machine building

Purchase-to-Pay

From internal requirement to payment: how causal process mining makes approval bypasses, rework, capacity dependencies and supplier performance in purchase-to-pay visible and explainable.

What is Purchase-to-Pay?

Purchase-to-Pay (P2P) is the end-to-end process from an emerging procurement need to the payment of an invoice. In special machine building it covers purchase requisition and approval, purchase order and order items, physical or digital fulfilment, goods receipt and inspection, and invoice, approval and payment. On a process slide it looks linear – in the operational data P2P is a network of connected business objects. Noreja takes this data in at full granularity in the event knowledge graph and derives the fitting process perspective only for a concrete business question.

Note: all figures come from a synthetic demonstration dataset. They illustrate analysis paths, business relationships and methods of causal process mining and are not production figures of any customer.

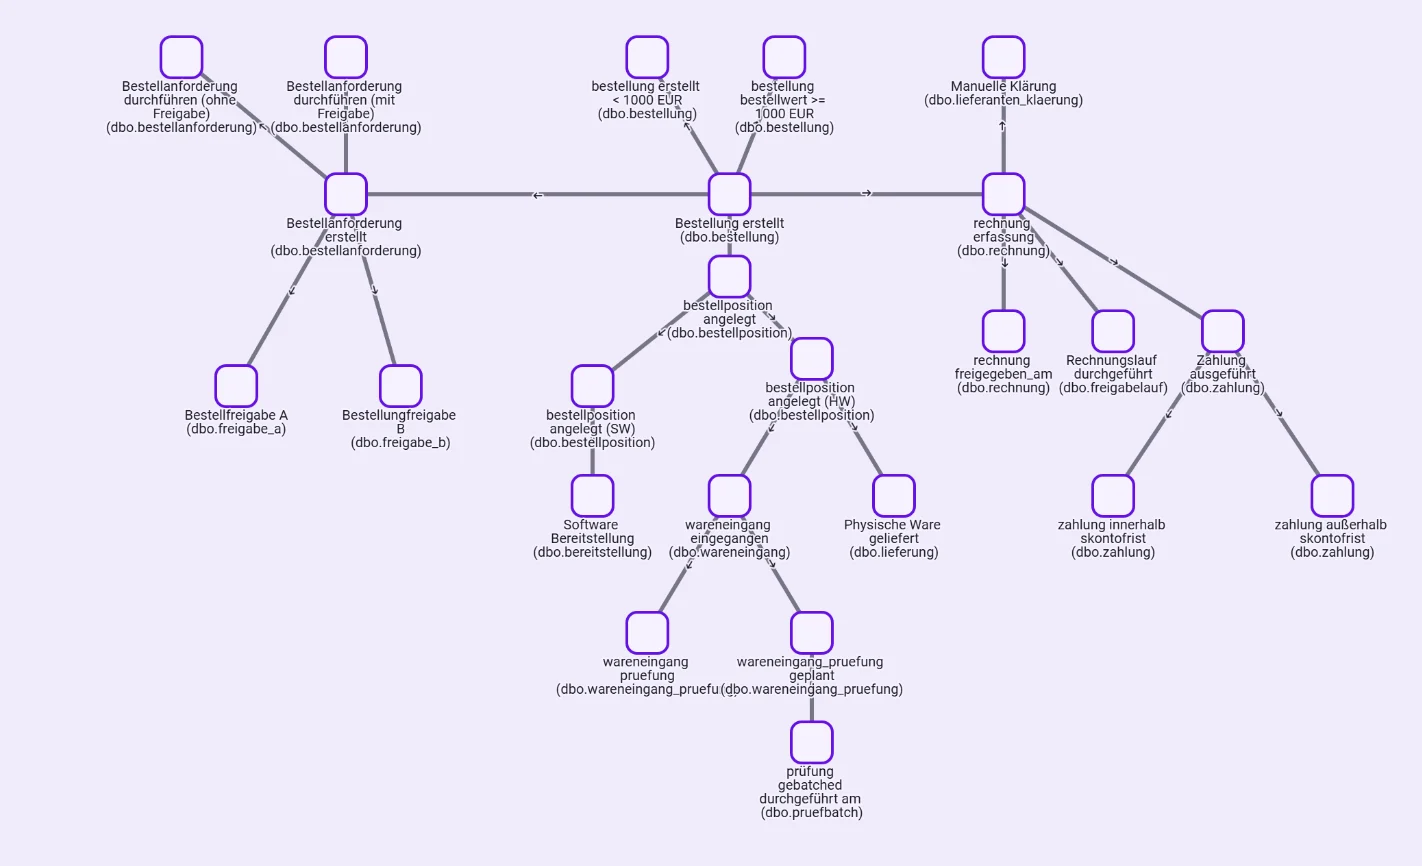
Event knowledge graph of the purchase-to-pay process: purchase requisition, approvals A and B, purchase order, order items for hardware and software, goods receipt, inspection, invoice, invoice run and payment as connected objects
Event knowledge graph of the purchase-to-pay process: business objects and their relationships are preserved.

At a glance

1,145

Maverick buying

26.3% of requisitions requiring approval bypass the intended approval path

647

Invoice rework

cases in two visible rework loops with 554 and 93 cases

92

Inspection capacity exceeded

1.62% of 5,670 goods-receipt inspections

2,209

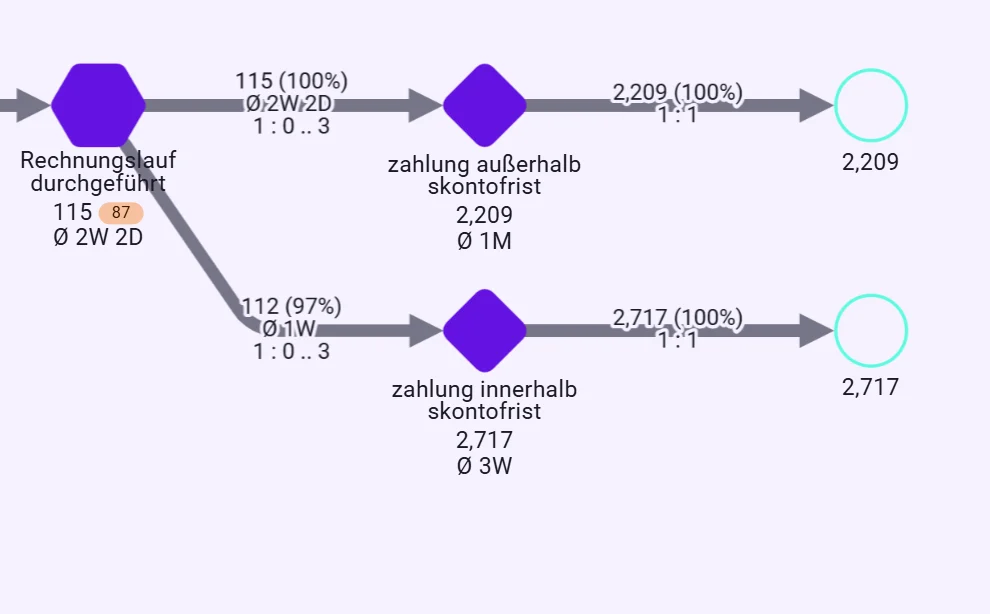
Payments after discount period

compared to 2,717 payments within the cash discount period

≈ €1.02m

Modelled lost cash discount

perspective-wide demonstration value across all payments outside the discount period

3

Conspicuous supplier groups

about 14 to 15.5 days instead of mostly about 5.5 to 6.2 days for the other suppliers

The process in four phases

The end-to-end perspective connects the parts of the shared process knowledge that matter for the business question. It reduces complexity for the process manager without losing the underlying object relationships.

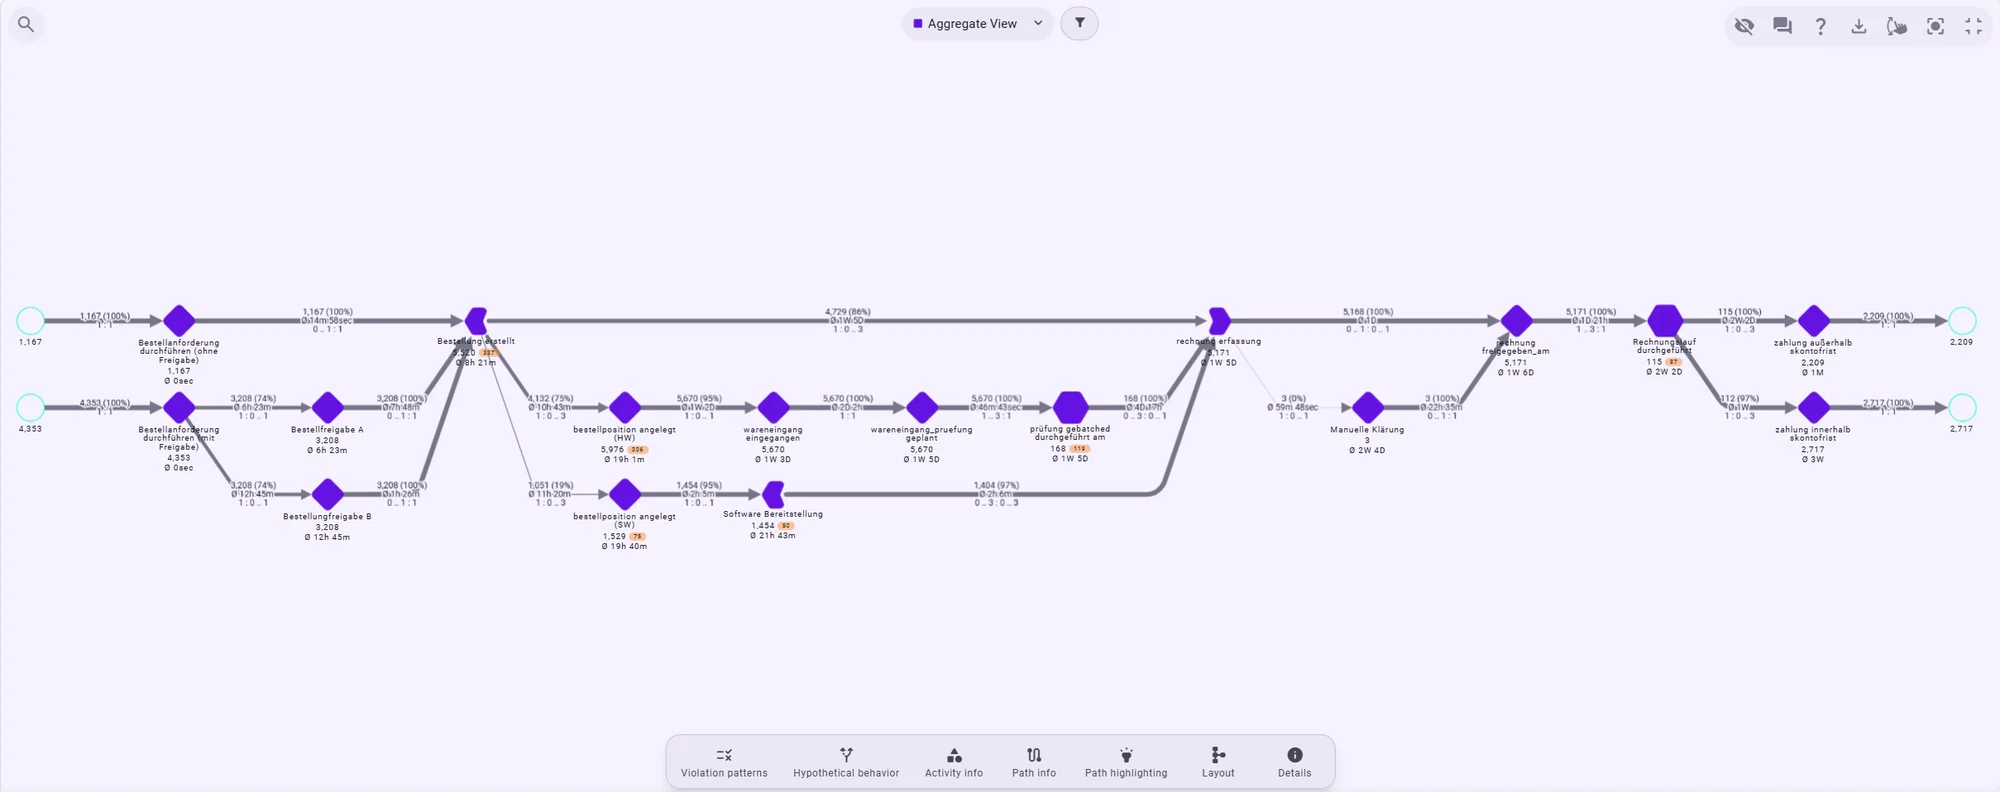
End-to-end perspective of the purchase-to-pay process from purchase requisition with and without approval through purchase order, goods receipt and inspection to invoice and payment within or outside the cash discount period
End-to-end perspective of the purchase-to-pay process.

Phase 1

Requirement & approval

A purchase requisition is created. Depending on value and procurement context it either continues directly or passes through a multi-level approval path. Only then is the purchase order created.

Business objects

  • Purchase requisition
  • Approval A
  • Approval B
  • Purchase order
  • Requester
  • Cost centre
  1. Requisition created
  2. Determine approval need
  3. Approval A
  4. Approval B
  5. Purchase order created

Guiding question

Are the approvals intended for this specific requirement actually carried out?

Phase 2

Purchase order & fulfilment path

After the purchase order, order items are created. Depending on the product group the paths differ: physical procurement needs delivery and goods receipt, software can be handled through a provisioning step.

Business objects

  • Purchase order
  • Order item
  • Material
  • Supplier
  • Contract
  • Delivery
  • Software provisioning

Physical goods

  1. 1Order item created (HW)
  2. 2Delivery
  3. 3Goods receipt
  4. 4Goods-receipt inspection

Software

  1. 1Order item created (SW)
  2. 2Software provisioning

Guiding question

Which procurement path is intended for each item – and where do lead time or behaviour differ?

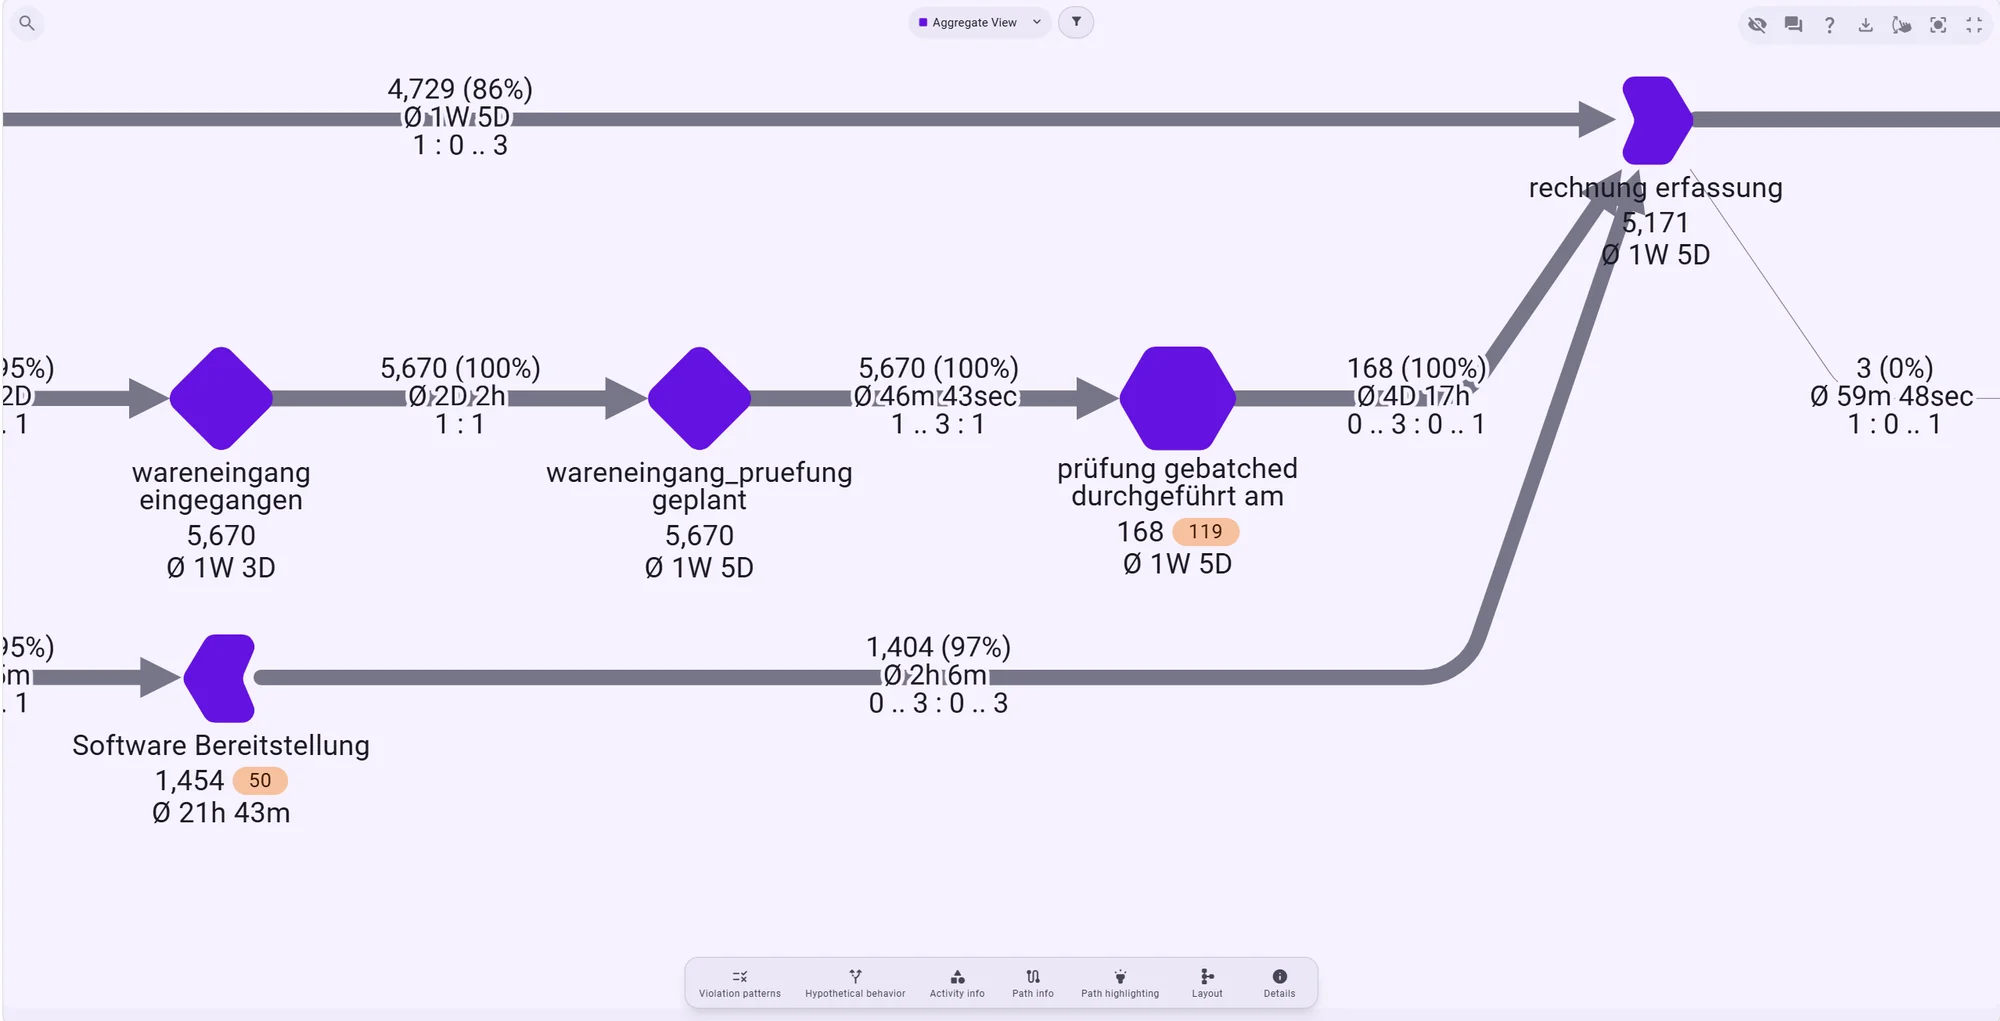
Process graph with the physical path via goods receipt, planned and batched inspection, and the software path via software provisioning, both leading into invoice capture
Physical path and software path up to the invoice.

Phase 3

Goods receipt & inspection

Physical goods are inspected after receipt. Not every case works on its own: many goods receipts share inspection resources and are processed in batched inspection runs.

Business objects

  • Goods receipt
  • Goods-receipt inspection
  • Inspection station
  • Inspection batch
  1. Goods received
  2. Inspection planned
  3. Batched inspection performed

Guiding question

Is a case waiting because of its own flow – or because several cases share the same resource and inspection run?

Phase 4

Invoice, approval & payment

Once the order is fulfilled, the invoice is captured, approved and processed in the invoice run. Business deviations can trigger manual clarification or rework. For payment control it also matters whether payment happens within the cash discount period.

Business objects

  • Invoice
  • Invoice approval
  • Invoice run
  • Payment
  • Supplier clarification
  • Cash discount period
  1. Invoice captured
  2. Invoice approved
  3. Invoice run performed
  4. Payment executed

Guiding question

Which process conditions create rework, waiting time or a measurable financial effect?

A requisition can trigger different approval logics, a purchase order can contain several items, several goods receipts share inspection capacity, and invoices relate to purchase order, goods receipt, conditions and payment. Exactly these relationships are preserved in the event knowledge graph.

Five findings along the purchase-to-pay process

The findings answer different business questions. What matters is not only what stands out, but why it happens, which conditions are behind it and which lever follows from it.

Finding 1 · Compliance

The fastest path is the wrong one

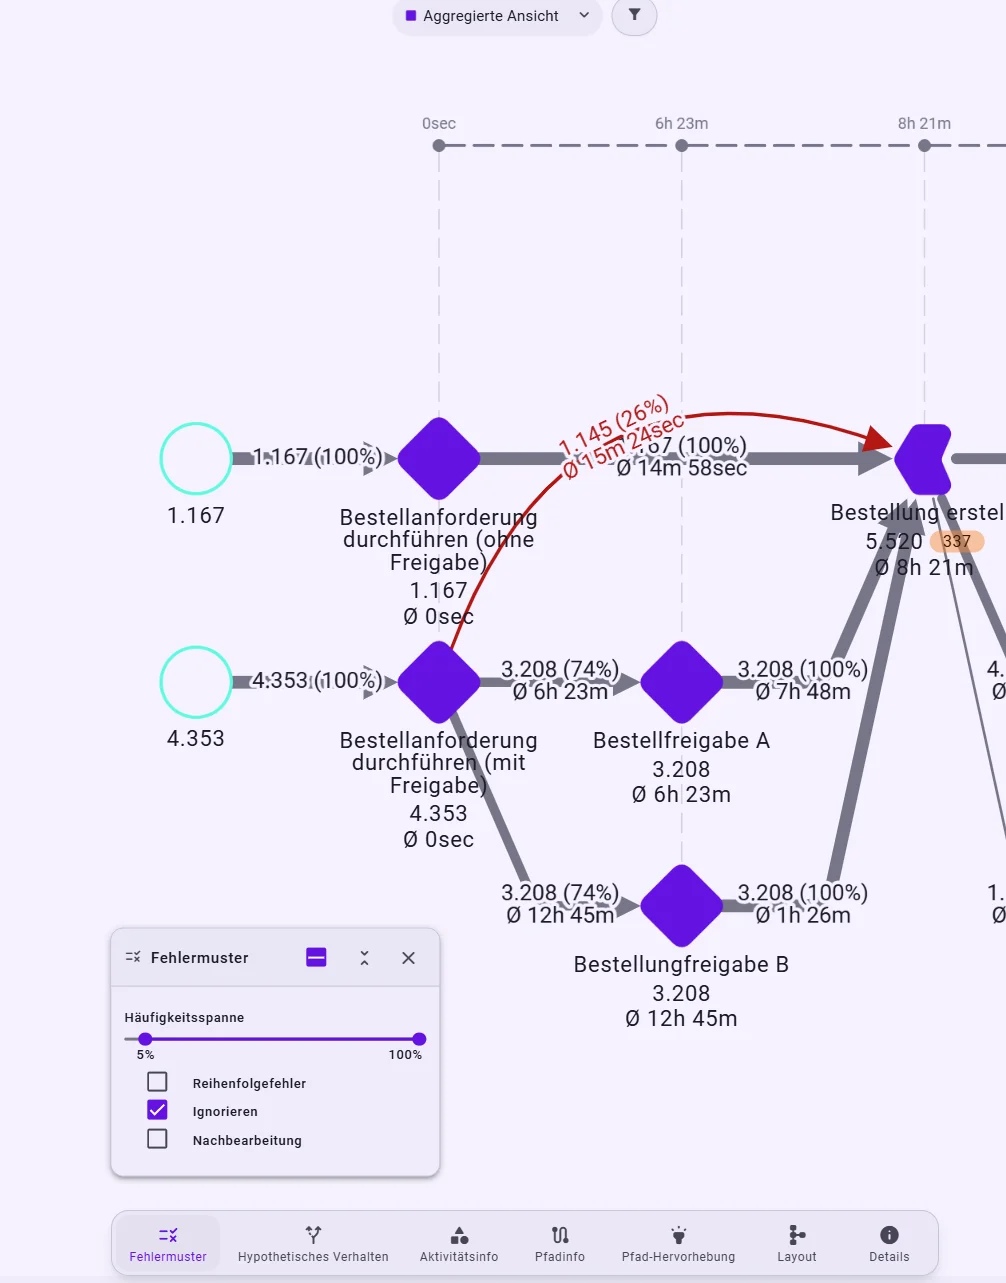
Not every process problem shows up as a delay. In procurement a case can even be particularly fast because necessary control steps are missing. The Analyzer therefore does not treat the direct transition as just another process variant but classifies it as ignoring an intended approval path.

The direct path takes only about 15 minutes to the purchase order on average; the regular path through the approvals takes several hours. That is the conflict: what looks attractive from a performance view is problematic from a governance and compliance view.

1,145

requisitions requiring approval go straight to a purchase order (26.3%)

Instead of “Which variant is particularly fast?”

the analysis asks: “Which necessary control is missing – and on which business objects does the behaviour concentrate?”

Purchase requisition process graph: red direct path from the requisition requiring approval to the purchase order (1,145 cases, 26%, about 15 minutes), bypassing approvals A and B
Maverick buying as the error pattern “ignore”: the direct path bypasses approvals A and B.

From 1,145 cases to a concrete cause hypothesis

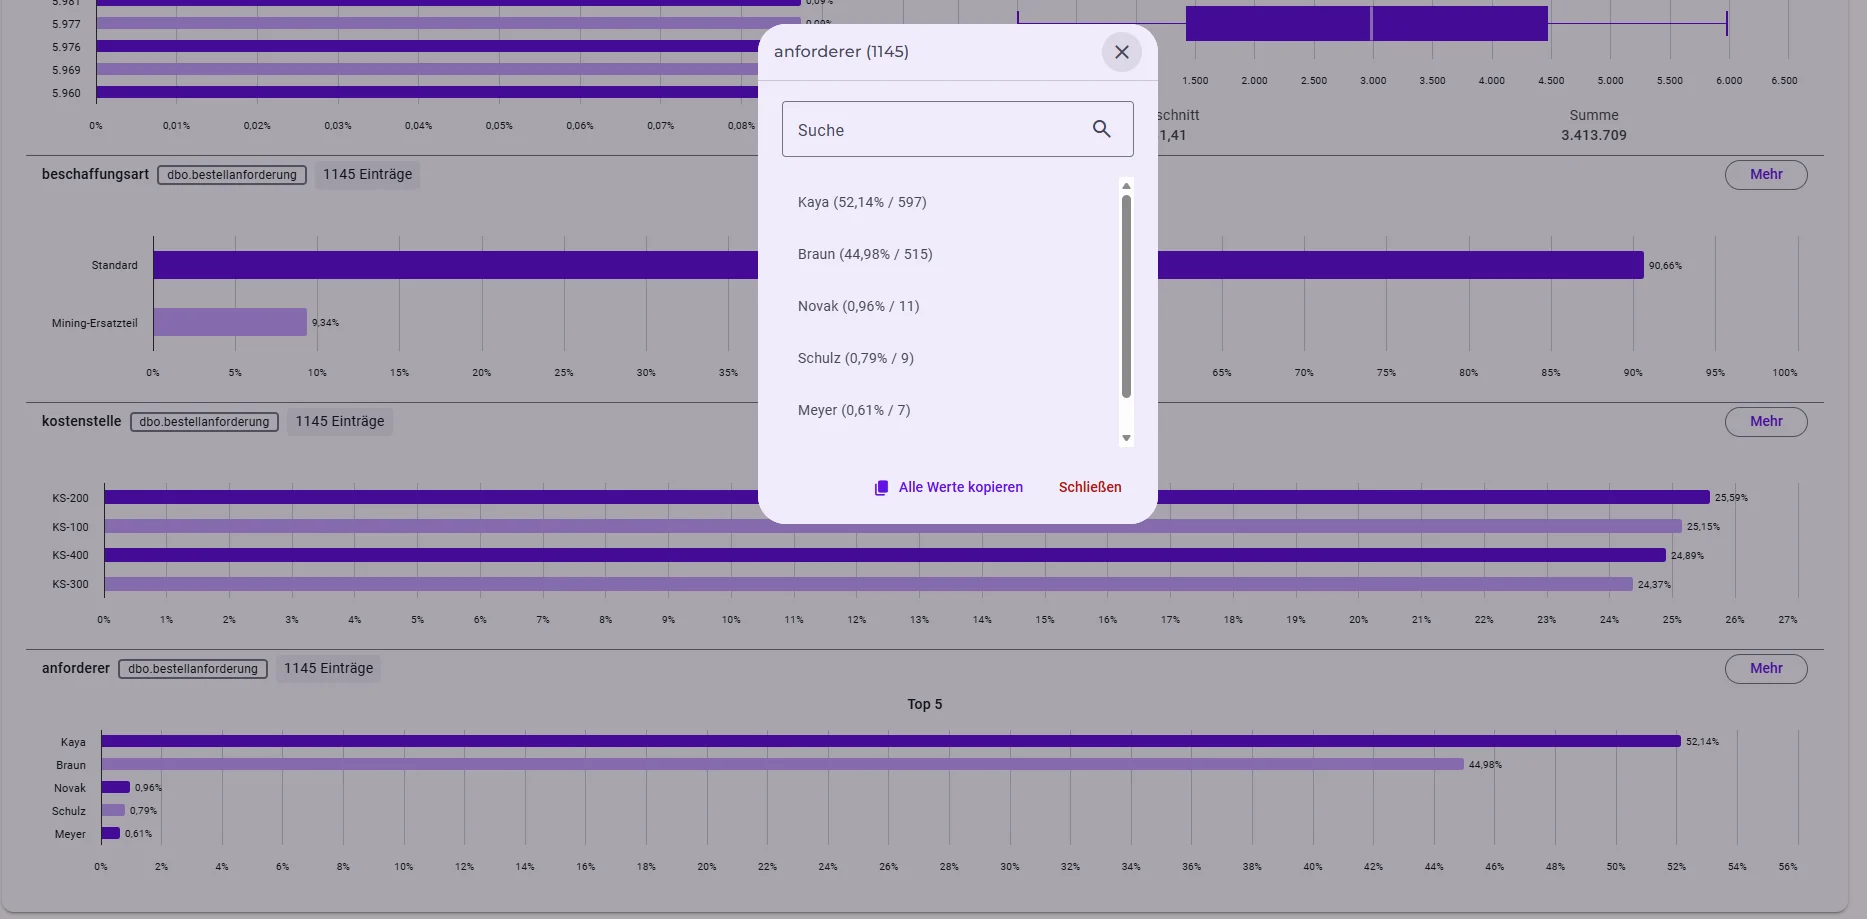
The next step examines the affected business objects for shared characteristics. Of the 1,145 cases, 597 belong to the requester Kaya and 515 to Braun – together about 97% of the visible maverick buying cases. The cost centres, by contrast, are distributed much more evenly.

An abstract compliance finding thus becomes a concrete organisational hypothesis: why does the approval bypass concentrate on this group of requesters? Possible explanations – permissions, time pressure, local ways of working or undocumented special rules – have to be checked by the business. The analysis narrows down the relevant population without inventing the organisational reason.

Attribute distribution of the 1,145 maverick buying cases: requester Kaya 52.14% and Braun 44.98%, cost centres KS-100 to KS-400 almost evenly distributed
Attribute distribution of maverick buying cases: two requesters, evenly distributed cost centres.

Finding 2 · Invoice processing

Rework is a symptom, context provides the explanation

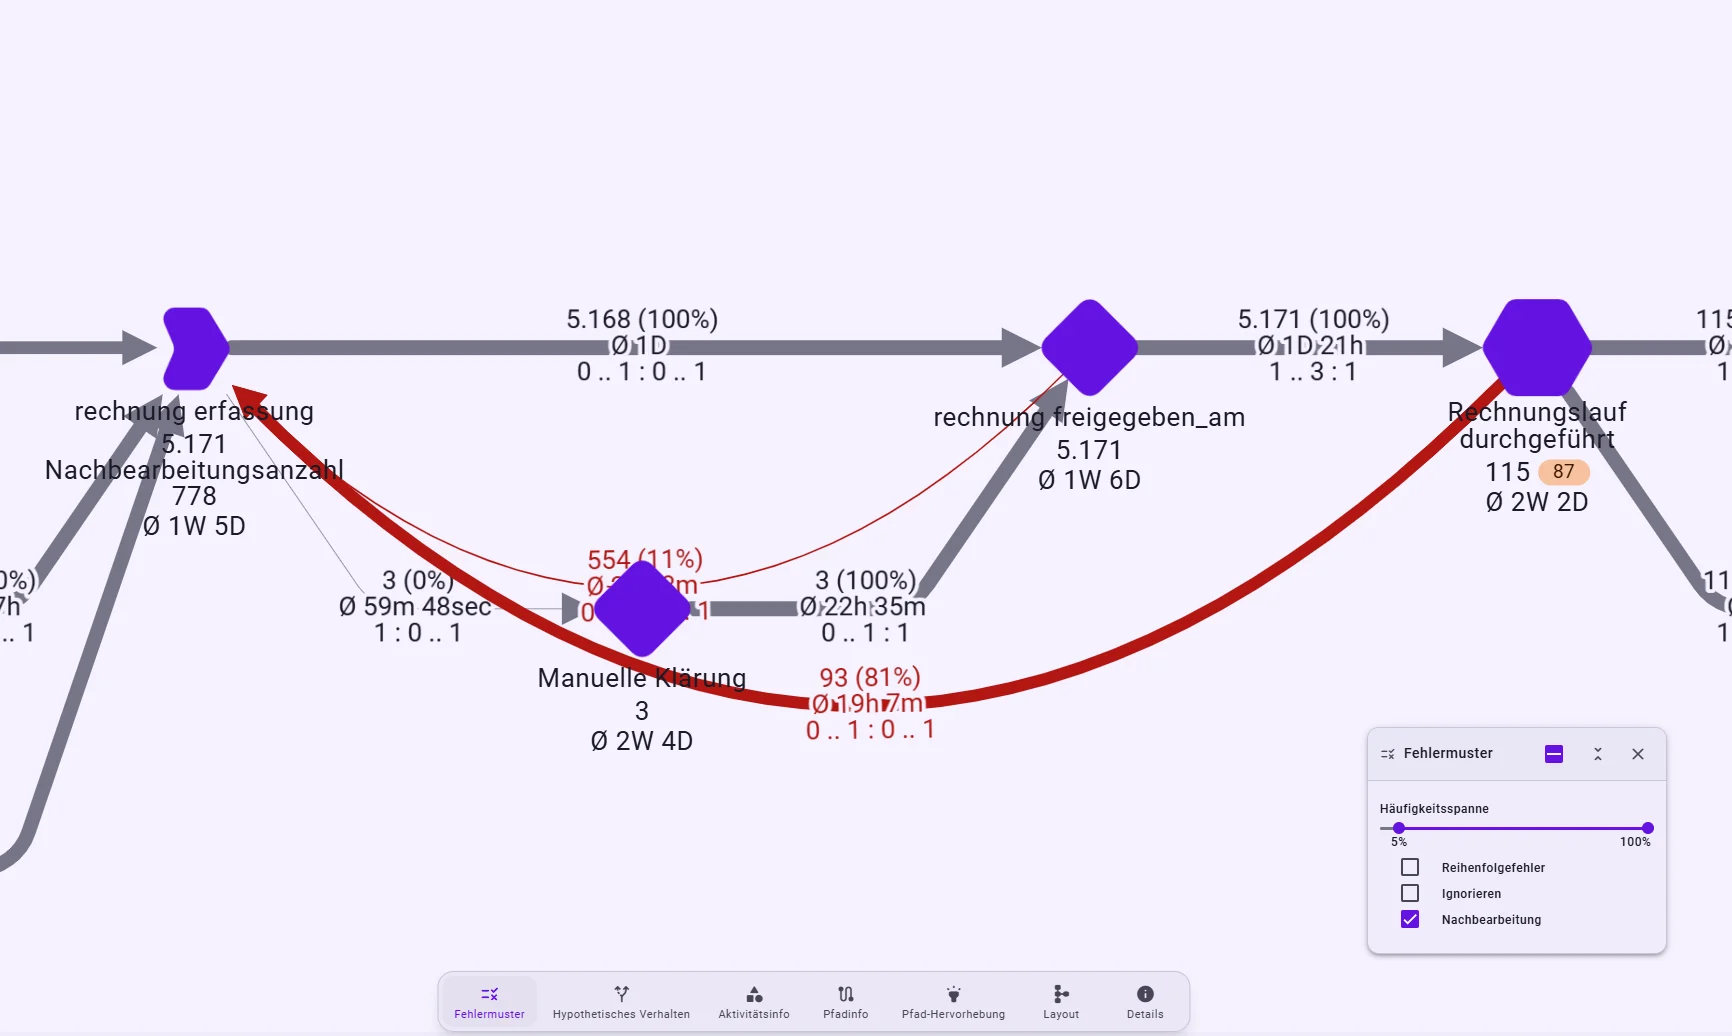
Long invoice lead times can come from waiting, approval, clarification or genuine rework. So the analysis does not just measure duration but classifies the observed behaviour as an error pattern: two rework loops cover 554 and 93 cases.

The statement “invoices are reworked” is not yet enough for an improvement, though. What matters is why manual clarification becomes necessary.

647

cases in two visible rework loops (554 and 93 cases)

Instead of “Where is lead time long?”

the analysis asks: “Which business inconsistency creates the rework – and which information outside the operational process data explains it?”

Invoice processing graph with the error pattern “rework” active: red loops from invoice capture via manual clarification (554 cases) and back from the invoice run (93 cases)
Rework in invoice processing: two visible rework loops.

Process data plus business context

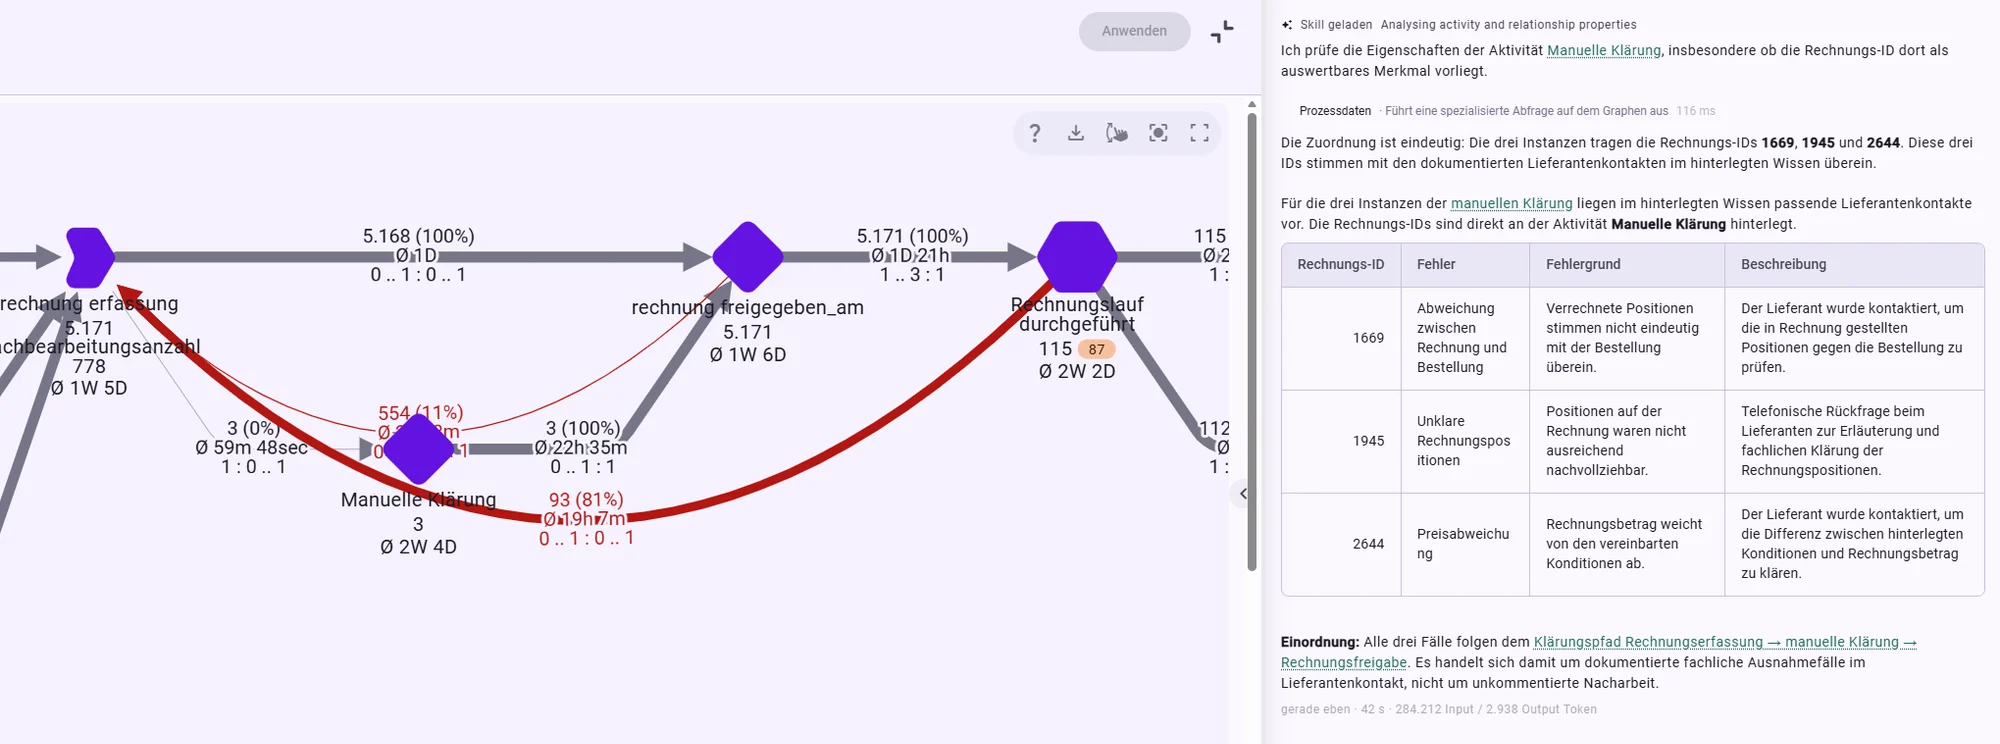
In the demo, additional information from an IT/support ticket system was brought into Noreja Context. Minerva links the affected invoices to this context via their invoice ID. Concrete clarification reasons become visible: mismatch between invoice and purchase order, unclear invoice items and price deviation from the agreed conditions.

The statement thus changes to: “These business reasons trigger the rework.” That is decisive for deriving measures – quantity or order mismatches need different countermeasures than unclear invoice items or wrong condition data.

Minerva answer next to the process graph: table with invoice IDs 1669, 1945 and 2644 and their clarification reasons – mismatch to the order, unclear items, price deviation
Minerva links invoice rework with context from the ticket system.

Finding 3 · Shared capacity

When several cases share the same resource

Goods-receipt inspections are not just isolated steps of a single purchase order. Several inspections can be assigned to the same inspection run and share the available resources. A case can be correct and still wait because other cases claim the same inspection slot.

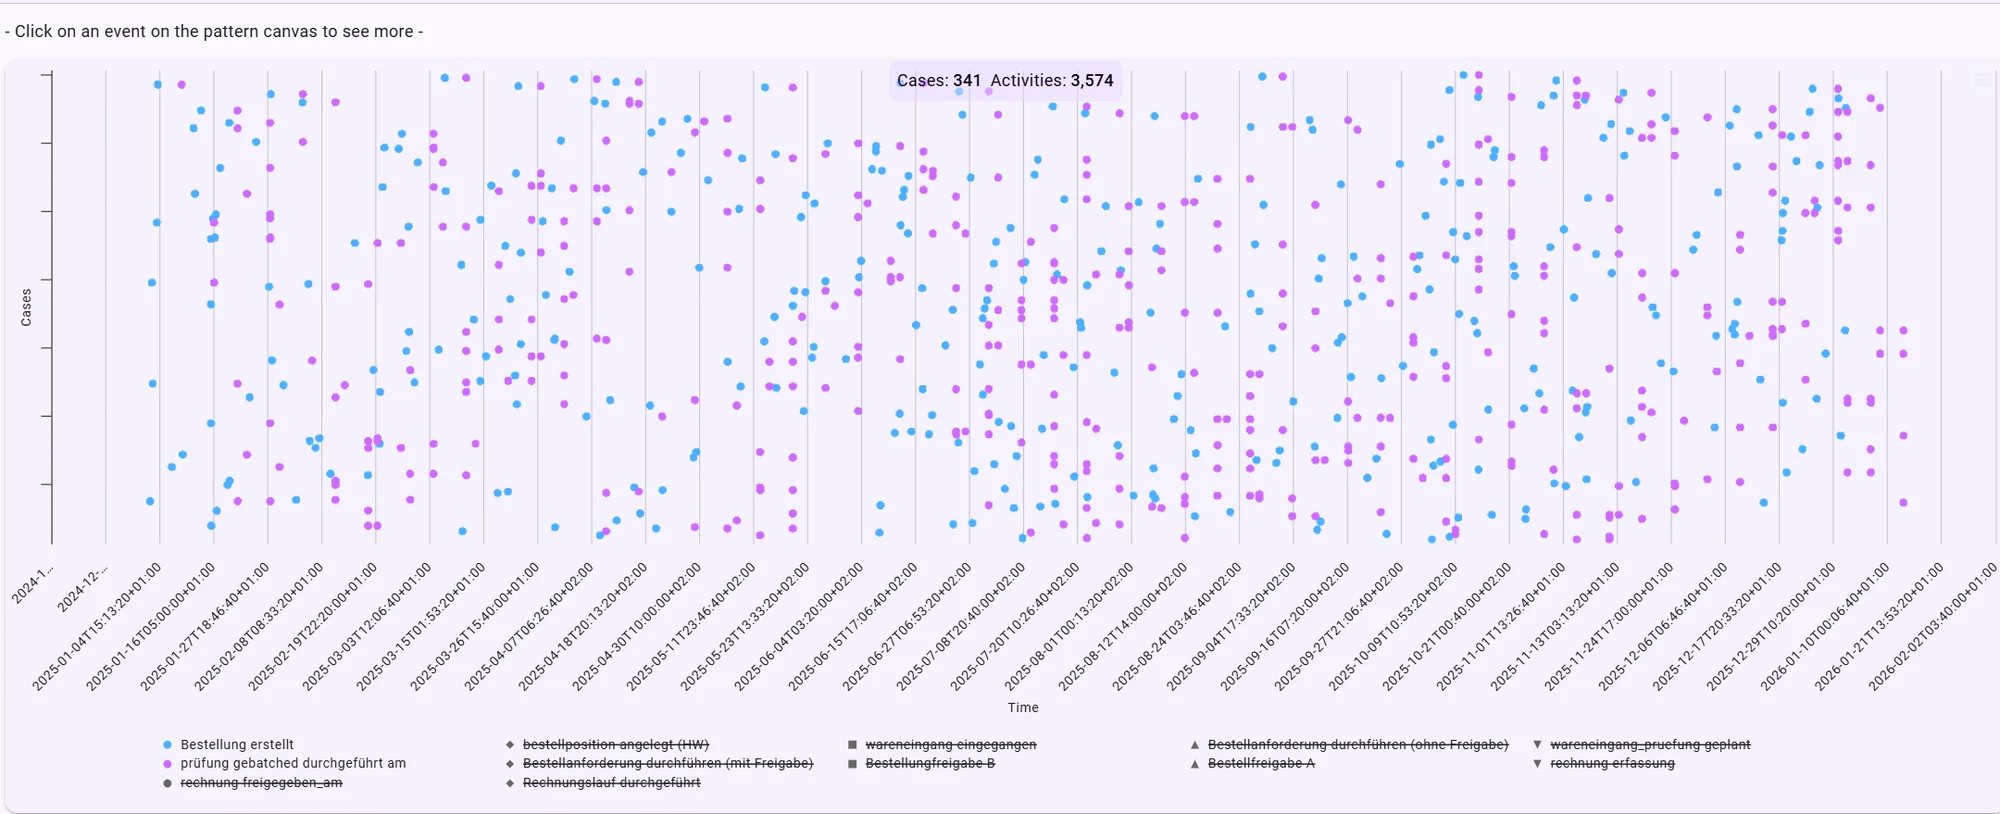
The time perspective makes this logic visible: while purchase orders and goods receipts arise spread out over time, the batched inspections concentrate on recurring points in time.

92

goods-receipt inspections with exceeded inspection capacity (1.62% of 5,670)

Instead of “The inspection is slow.”

the analysis asks: “Which shared resource is holding back these specific cases – and under which conditions does the backlog build up?”

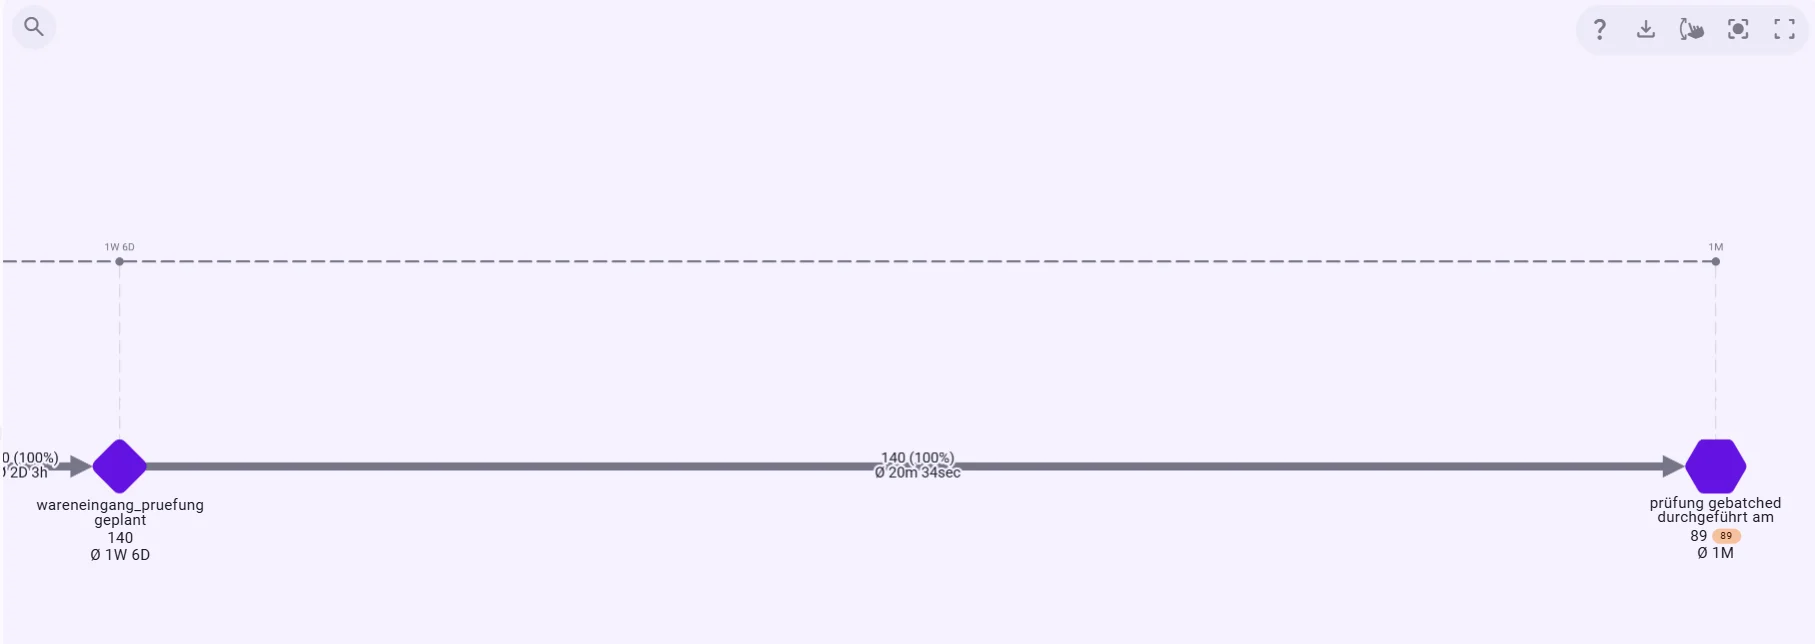
Process graph from “inspection planned” to “batched inspection performed” with a time axis
Planned goods-receipt inspections and shared inspection batches.
Dotted chart over time: purchase orders spread out, batched inspections concentrated on recurring points in time
Time pattern of batched goods-receipt inspection.

Isolating capacity overruns

In the synthetic run, 92 goods-receipt inspections can be identified where the available inspection capacity was exceeded at the planned time. The general time pattern thus becomes a concrete operational finding: the waiting time is linked to a documented process condition – the shared capacity was not sufficient for these cases.

  • Are the inspection intervals sized appropriately?
  • Do certain material groups need to be prioritised?
  • Does additional capacity make sense?
  • Can inspection rules be differentiated?
  • Which objects repeatedly cause the backlog?

Finding 4 · Payment

From a visible correlation to a tested effect

The end-to-end process shows whether payments happen within or outside the cash discount period. The lost discount is quantified down to the euro as a separate payment attribute; for the 2,209 payments outside the period the modelled total is about €1.02m.

This raises an economically relevant question: which process conditions actually contribute to the discount period being missed?

2,209

payments outside the cash discount period (vs. 2,717 within) · modelled lost discount about €1.02m

Instead of “Where do we see waiting time and cost at the same time?”

the analysis asks: “Which changeable condition actually explains the economic effect?”

Process graph from the invoice run: branching into “payment outside discount period” (2,209) and “payment within discount period” (2,717)
Payments within and outside the cash discount period.
Attribute evaluation skonto_verlust_eur across 2,209 payments with distribution and a sum of €1,022,005.75
Modelled lost cash discount as a payment attribute: €1,022,005.75 in the demo dataset.

Causality also means sharpening hypotheses

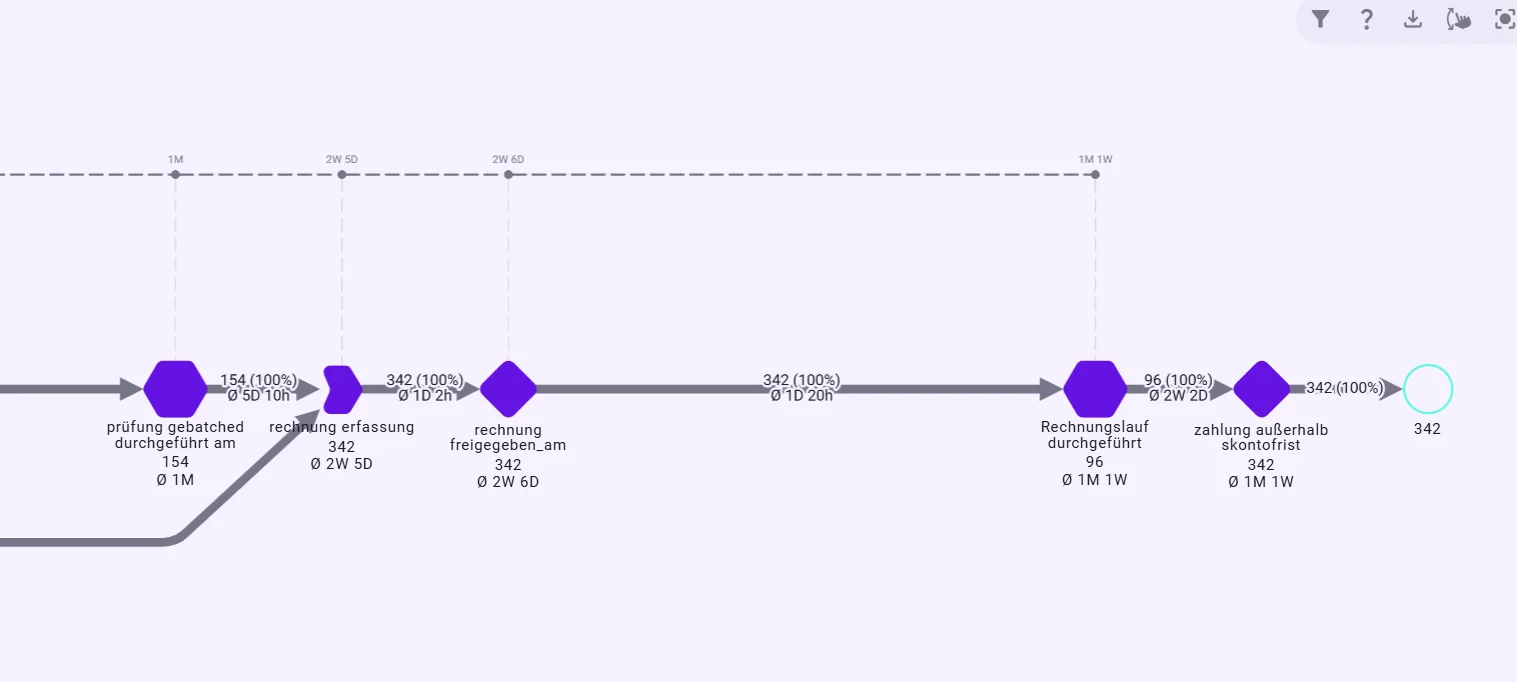
A plausible first hypothesis: the backlog in goods-receipt inspection delays later payments. Noreja therefore follows the inspections that actually exceeded capacity along their relationships all the way to payment.

The analysis separates two things that are easily confused in a plain end-to-end view: an operational bottleneck can be real without automatically being the sole driver of a financial effect visible later. The inspection backlog remains a relevant operational finding; for the lost discount, invoice run, payment control, business clarifications and further conditions also have to be considered.

Process graph of the capacity-exceeding inspections: from “batched inspection performed” through invoice capture, approval and invoice run to “payment outside discount period”
Capacity-exceeding inspections, followed through to payment.

Finding 5 · Supplier performance

Same standard process, different lead time

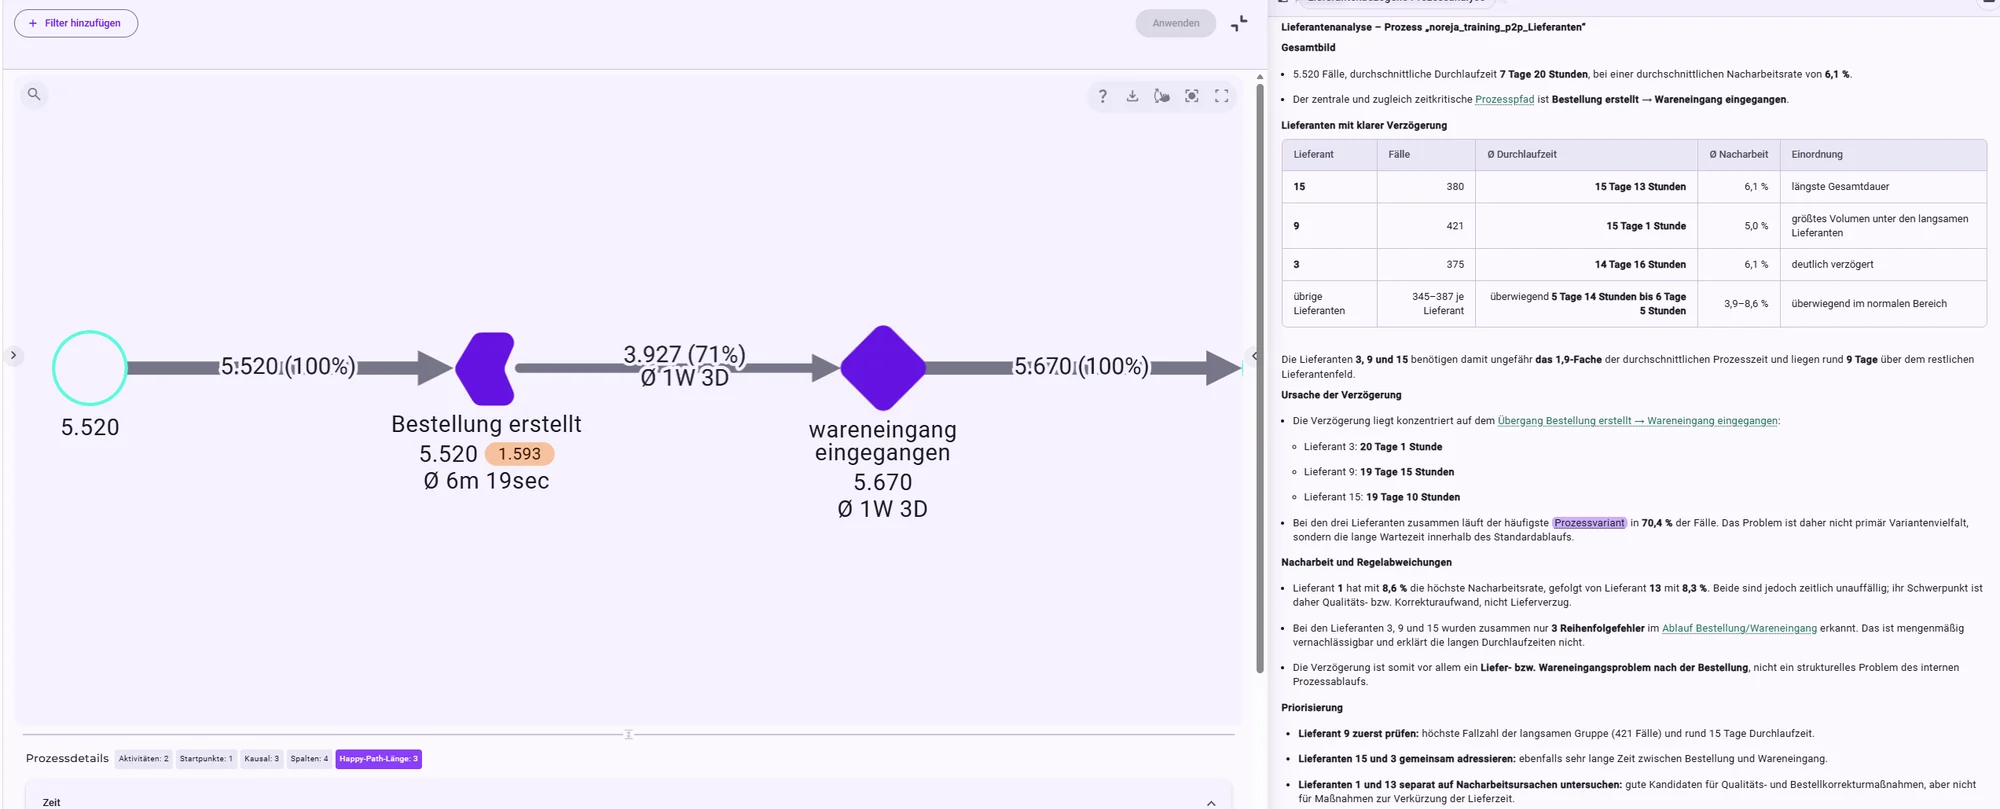
Not every delay originates in your own process. The supplier analysis compares the same procurement logic along the connected supplier objects. The extra time concentrates mainly on the transition purchase order created → goods received.

At the same time the slow suppliers mostly follow the normal process path, and an unusually high rework rate does not explain their longer duration either. An internal workflow redesign does not address an external delivery delay – instead delivery times, material planning, agreements and supplier management move into focus.

≈ 2×

as long for three supplier groups: about 14 to 15.5 days instead of mostly 5.5 to 6.2 days

Instead of “Why is our P2P process slow?”

the analysis asks: “Why does the same standard process take much longer with certain suppliers?”

Supplier analysis: process graph purchase order created → goods received next to a Minerva evaluation showing three suppliers at about 14 to 15 days lead time
Supplier performance analysis: the delay lies between purchase order and goods receipt.

From individual findings to a picture of causes

The findings belong to the same end-to-end process but have different mechanisms. Minerva brings together the results from the different perspectives – not to construct one universal “root cause”, but to separate the cause–effect mechanisms cleanly.

AreaObservationFollow-up business question
Approval1,145 maverick buying casesWhy does the bypass concentrate on certain requesters?
Invoice647 visible rework casesWhich business clarification reasons recur?
Goods-receipt inspection92 capacity overrunsWhich shared resource creates the backlog?
Payment2,209 payments outside discount periodWhich process conditions drive the monetary effect?
Suppliersthree much slower groupsIs the lever internal or with the external partner?
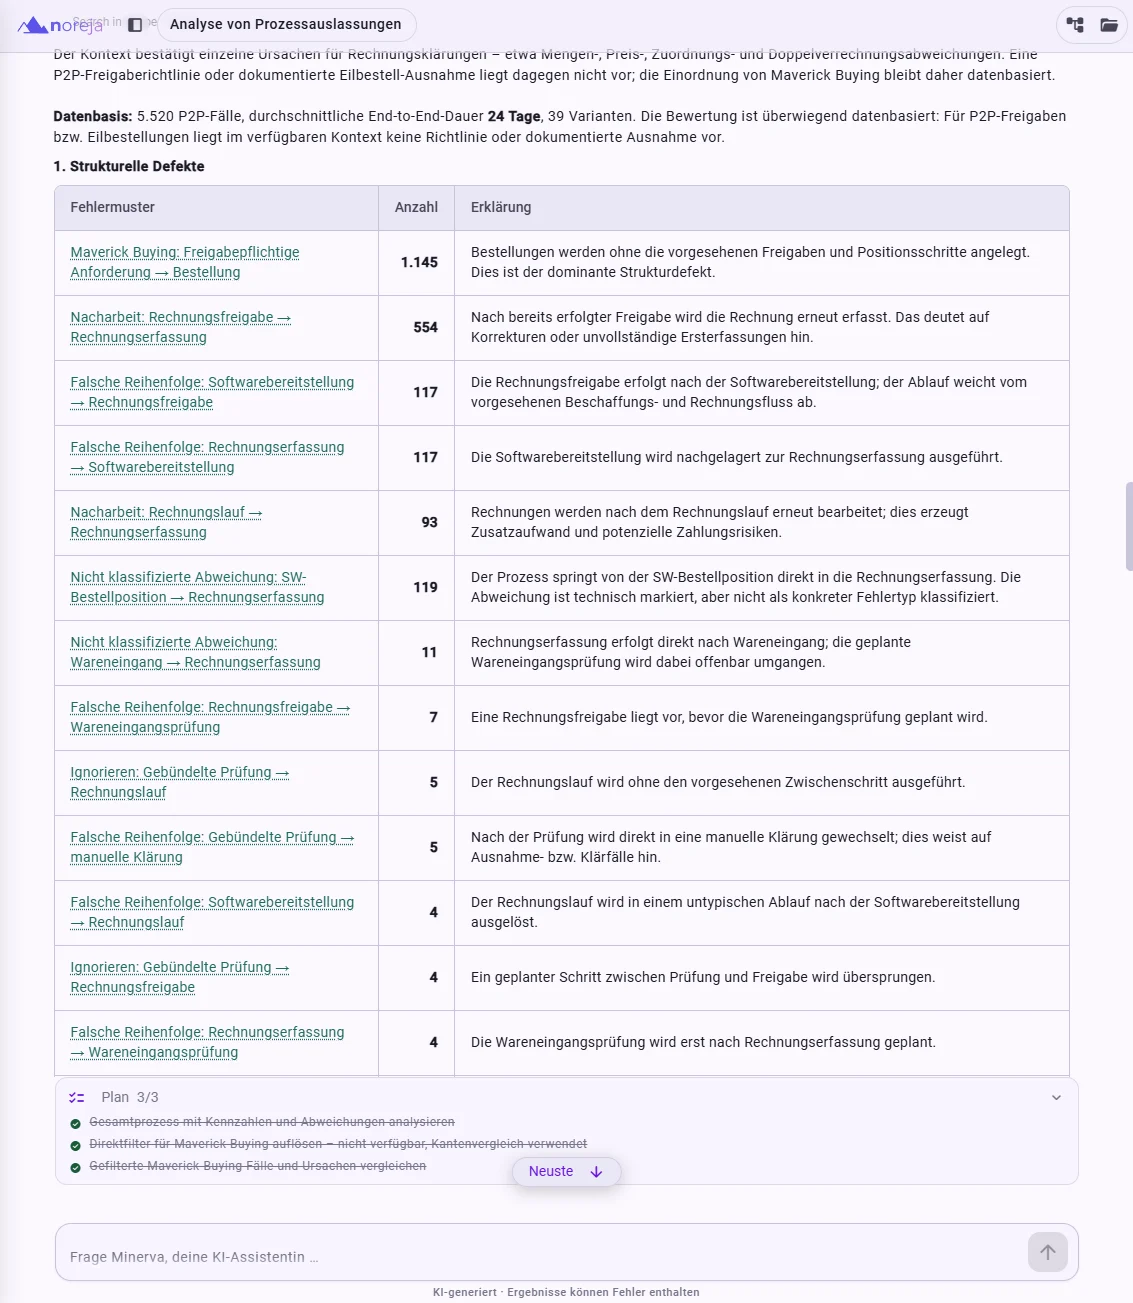
Minerva analysis of process omissions: table of structural defects in the P2P process, led by maverick buying (1,145) and invoice rework (554)
Minerva summarises structural deviations in the P2P process.
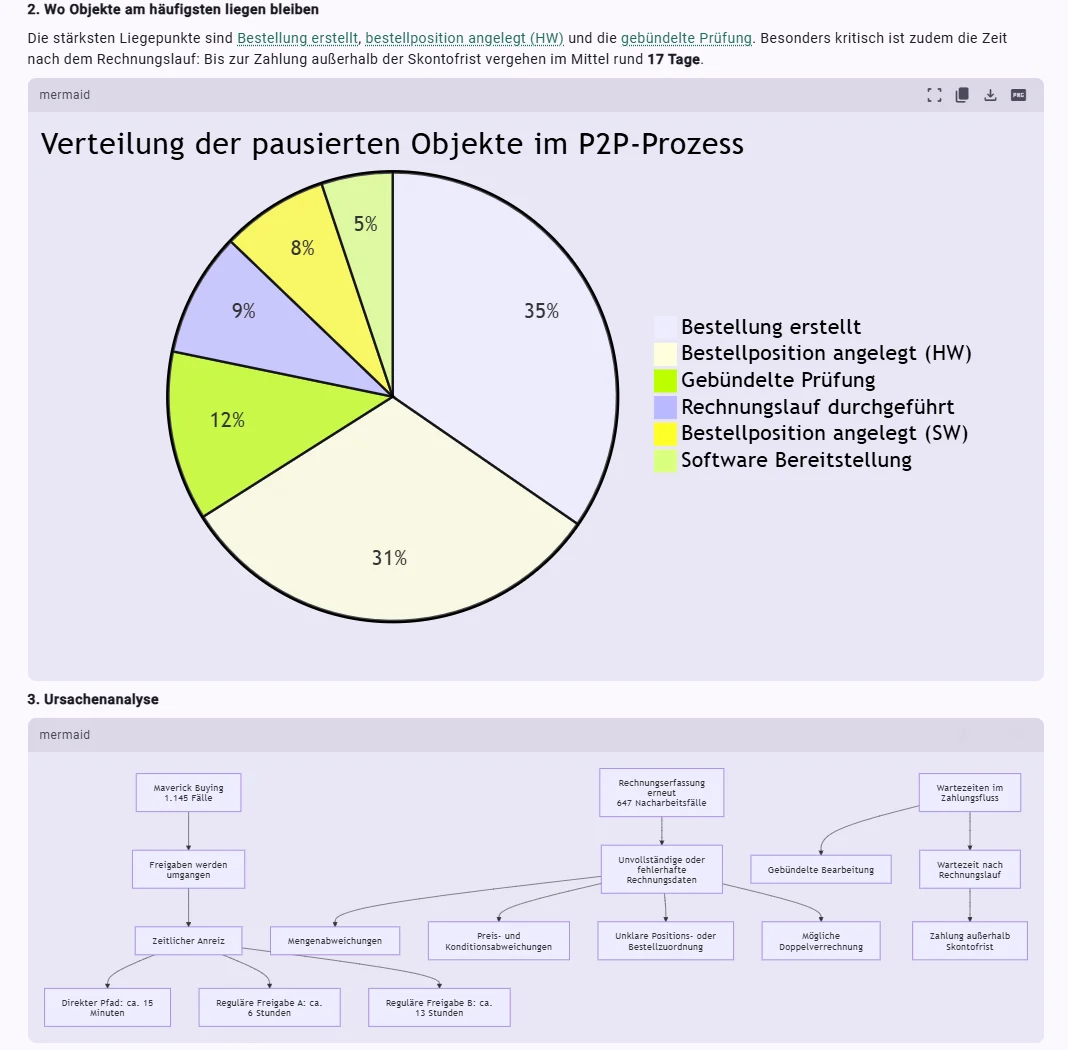
Minerva evaluation: pie chart of paused objects and a cause diagram with maverick buying, invoice rework, batched processing and payment outside the discount period
Minerva condenses the findings into a cause model.
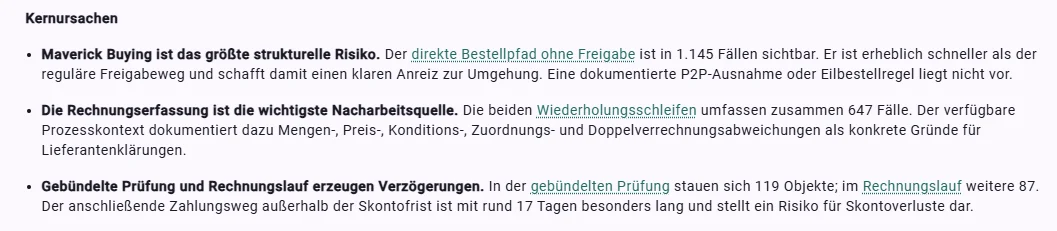
Core causes according to Minerva: maverick buying as the biggest structural risk, invoice capture as the main source of rework, batched inspection and invoice run as causes of delay
Condensed key statements from the Minerva analysis.

The business question comes first – not the operating logic of the analysis tool.

From finding to prioritised measure

A finding does not change a process yet. In the Business Impact Board, findings are rated by impact, implementation effort and uncertainty – process excellence and the business decide together which improvement initiative comes first and which deliberately follows later.

Example fields of action
FindingPossible improvement directionImpact to assess
Maverick buyingReview permissions and legitimate special rules, address bypass behaviour specificallyCompliance, governance, risk
Invoice reworkRun validations between purchase order, invoice and conditions earlierRework effort, lead time, quality
Inspection capacity / batchingOptimise inspection intervals, prioritisation and resource controlWaiting time, resource utilisation, stability
Lost cash discountExamine invoice run and payment logic for avoidable delaysCost, cash flow, discount utilisation
Supplier performanceAnalyse slow supplier groups specifically with delivery-time and material-planning dataSecurity of supply, lead time

Prioritisation is a business decision. Minerva prepares analysis paths, context and options; responsibility for the measure stays with the process owner and the business.

The loop: Insight → Action → Impact → Feedback

The analysis does not end with the finding, nor with implementing a measure. What matters is whether process behaviour actually changes afterwards.

  1. 1

    Insight

    Spot the error pattern, time pattern, missing prerequisite or conspicuous object group

  2. 2

    Action

    Understand the cause, formulate an improvement hypothesis, rate and prioritise impact and effort

  3. 3

    Impact

    Implement the measure and define the expected business or economic effect

  4. 4

    Feedback

    Measure the effect again with the same granular data and the same process logic

Check after every measure

  • Is maverick buying actually becoming less frequent?
  • Does invoice rework drop for the addressed clarification reasons?
  • Is the backlog at goods-receipt inspection going down?
  • Are delivery times of the affected suppliers becoming more stable?
  • Is cash discount utilisation actually improving?
  • Has the problem shifted, or has it really been solved?

Five principles behind the analysis

Keep granularity

Requisition, approval, purchase order, item, goods receipt, inspection, invoice and payment are kept with their relationships – not reduced up front to one linear process view.

Reduce complexity by business question

A concrete business question gets a fitting perspective on the event knowledge graph – simpler, without losing the relationships.

Test causal hypotheses

Anomalies are not automatically read as causes but tested against the observed effect along the same business objects.

Include context

Tickets, comments, quality notifications or other business information are linked to the affected business objects.

Operationalise insights

Findings become improvement hypotheses, are prioritised by impact, effort and uncertainty and measured again after implementation.

Frequently asked questions about Purchase-to-Pay

What is a purchase-to-pay process?

Purchase-to-pay is the end-to-end process from an emerging procurement need to payment. In the special machine building scenario shown, it covers purchase requisition, approvals, purchase order and order items, physical or digital fulfilment, goods receipt and inspection, and invoice, approval and payment.

Why is P2P particularly interesting for causal process mining?

Because many different business objects and dependencies interact. A purchase order can contain several items, physical and digital procurement follow different paths, inspection resources are used by several cases at once, and invoices relate to purchase order, goods receipt and conditions. Causes are therefore not always visible where their effect appears later.

What is maverick buying?

Here, maverick buying means that a purchase requisition that actually requires approval leads straight to a purchase order and the intended approval steps are bypassed. In the synthetic demo run this affects 1,145 cases, or 26.3% of requisitions requiring approval.

Why is a short lead time not automatically positive?

Because speed is only one dimension of process quality. The maverick buying path is much faster than the regular approval path precisely because controls are missing. A fast process can therefore be worse from a business perspective than a slower but compliant one.

How does additional context help with invoice rework?

The Analyzer first shows that rework or manual clarification takes place. Through Noreja Context, additional business information – for example from a ticket system – is linked to the affected invoice ID. This reveals concrete reasons such as order mismatches, unclear invoice items or condition problems.

What does cross-case dependency mean in goods-receipt inspection?

Several goods receipts share inspection resources and are processed in the same batch runs. A single case can therefore wait although its own history shows no error – the cause lies in a shared resource outside that one case.

Does the inspection backlog automatically cause the lost cash discount?

No. Goods-receipt inspection can be a real operational bottleneck. For the economic effect, however, it has to be checked separately whether the same affected business objects later actually miss the discount period disproportionately. Causal process mining separates visible correlations from tested cause–effect hypotheses.

What role does Minerva play?

Minerva helps the process manager investigate business questions across process knowledge, analysis results and additional context. It brings findings together, forms comparison groups, structures cause hypotheses and prepares analysis paths. The decision about measures stays with people.

How are findings prioritised?

Process owners rate findings for example by impact, implementation effort and uncertainty. An analytical anomaly thus becomes a prioritised improvement initiative whose effect is measured again against the granular process data after implementation.

Are the figures from a real special machine builder?

No. All figures come from a synthetic demonstration dataset. They make analysis paths, causal questions and the connection of process data with business context understandable.

The full case description

Event knowledge graph, end-to-end perspective, all five findings with their analysis steps, the Minerva cause model and the path to a prioritised measure – step by step in the Noreja Help Center (in German).

Read the case in the Help Center

Want to analyse your own process? Talk to us.

Ready to Start

Understand your end-to-end process causally — talk to us

Join companies that are redefining growth and efficiency with intelligent process analysis.